Three massive new briefings from the Prison Policy Initiative
316 graphs of state-by-state data on racial disparities and prison growth
by Peter Wagner and Leah Sakala, May 28, 2014
Today, the Prison Policy Initiative released two new briefings and a brand new way to access useful data about incarceration in your state.
We released:
 Breaking Down Mass Incarceration in the 2010 Census: State-by-State Incarceration Rates by Race/Ethnicity, by Leah Sakala
 Tracking State Prison Growth in 50 States, by Peter Wagner
 Breaking Down Mass Incarceration in the 2010 Census:
Also today, we launched 50 state profiles (and a national one) giving you one-click access both to the findings of these two new briefings and to the highlights of all of our work over the last 13 years on each state:
All told, we produced 316 new graphs for you to use, including these two never-seen-before graphs from the U.S. profile page:
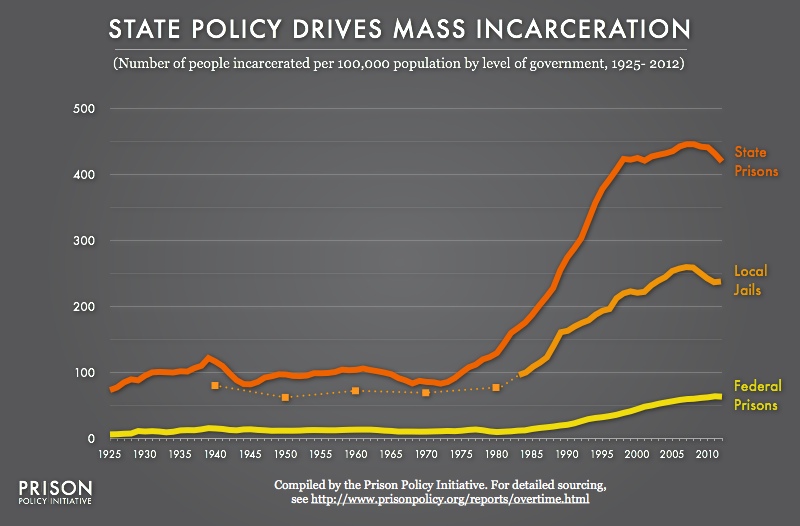
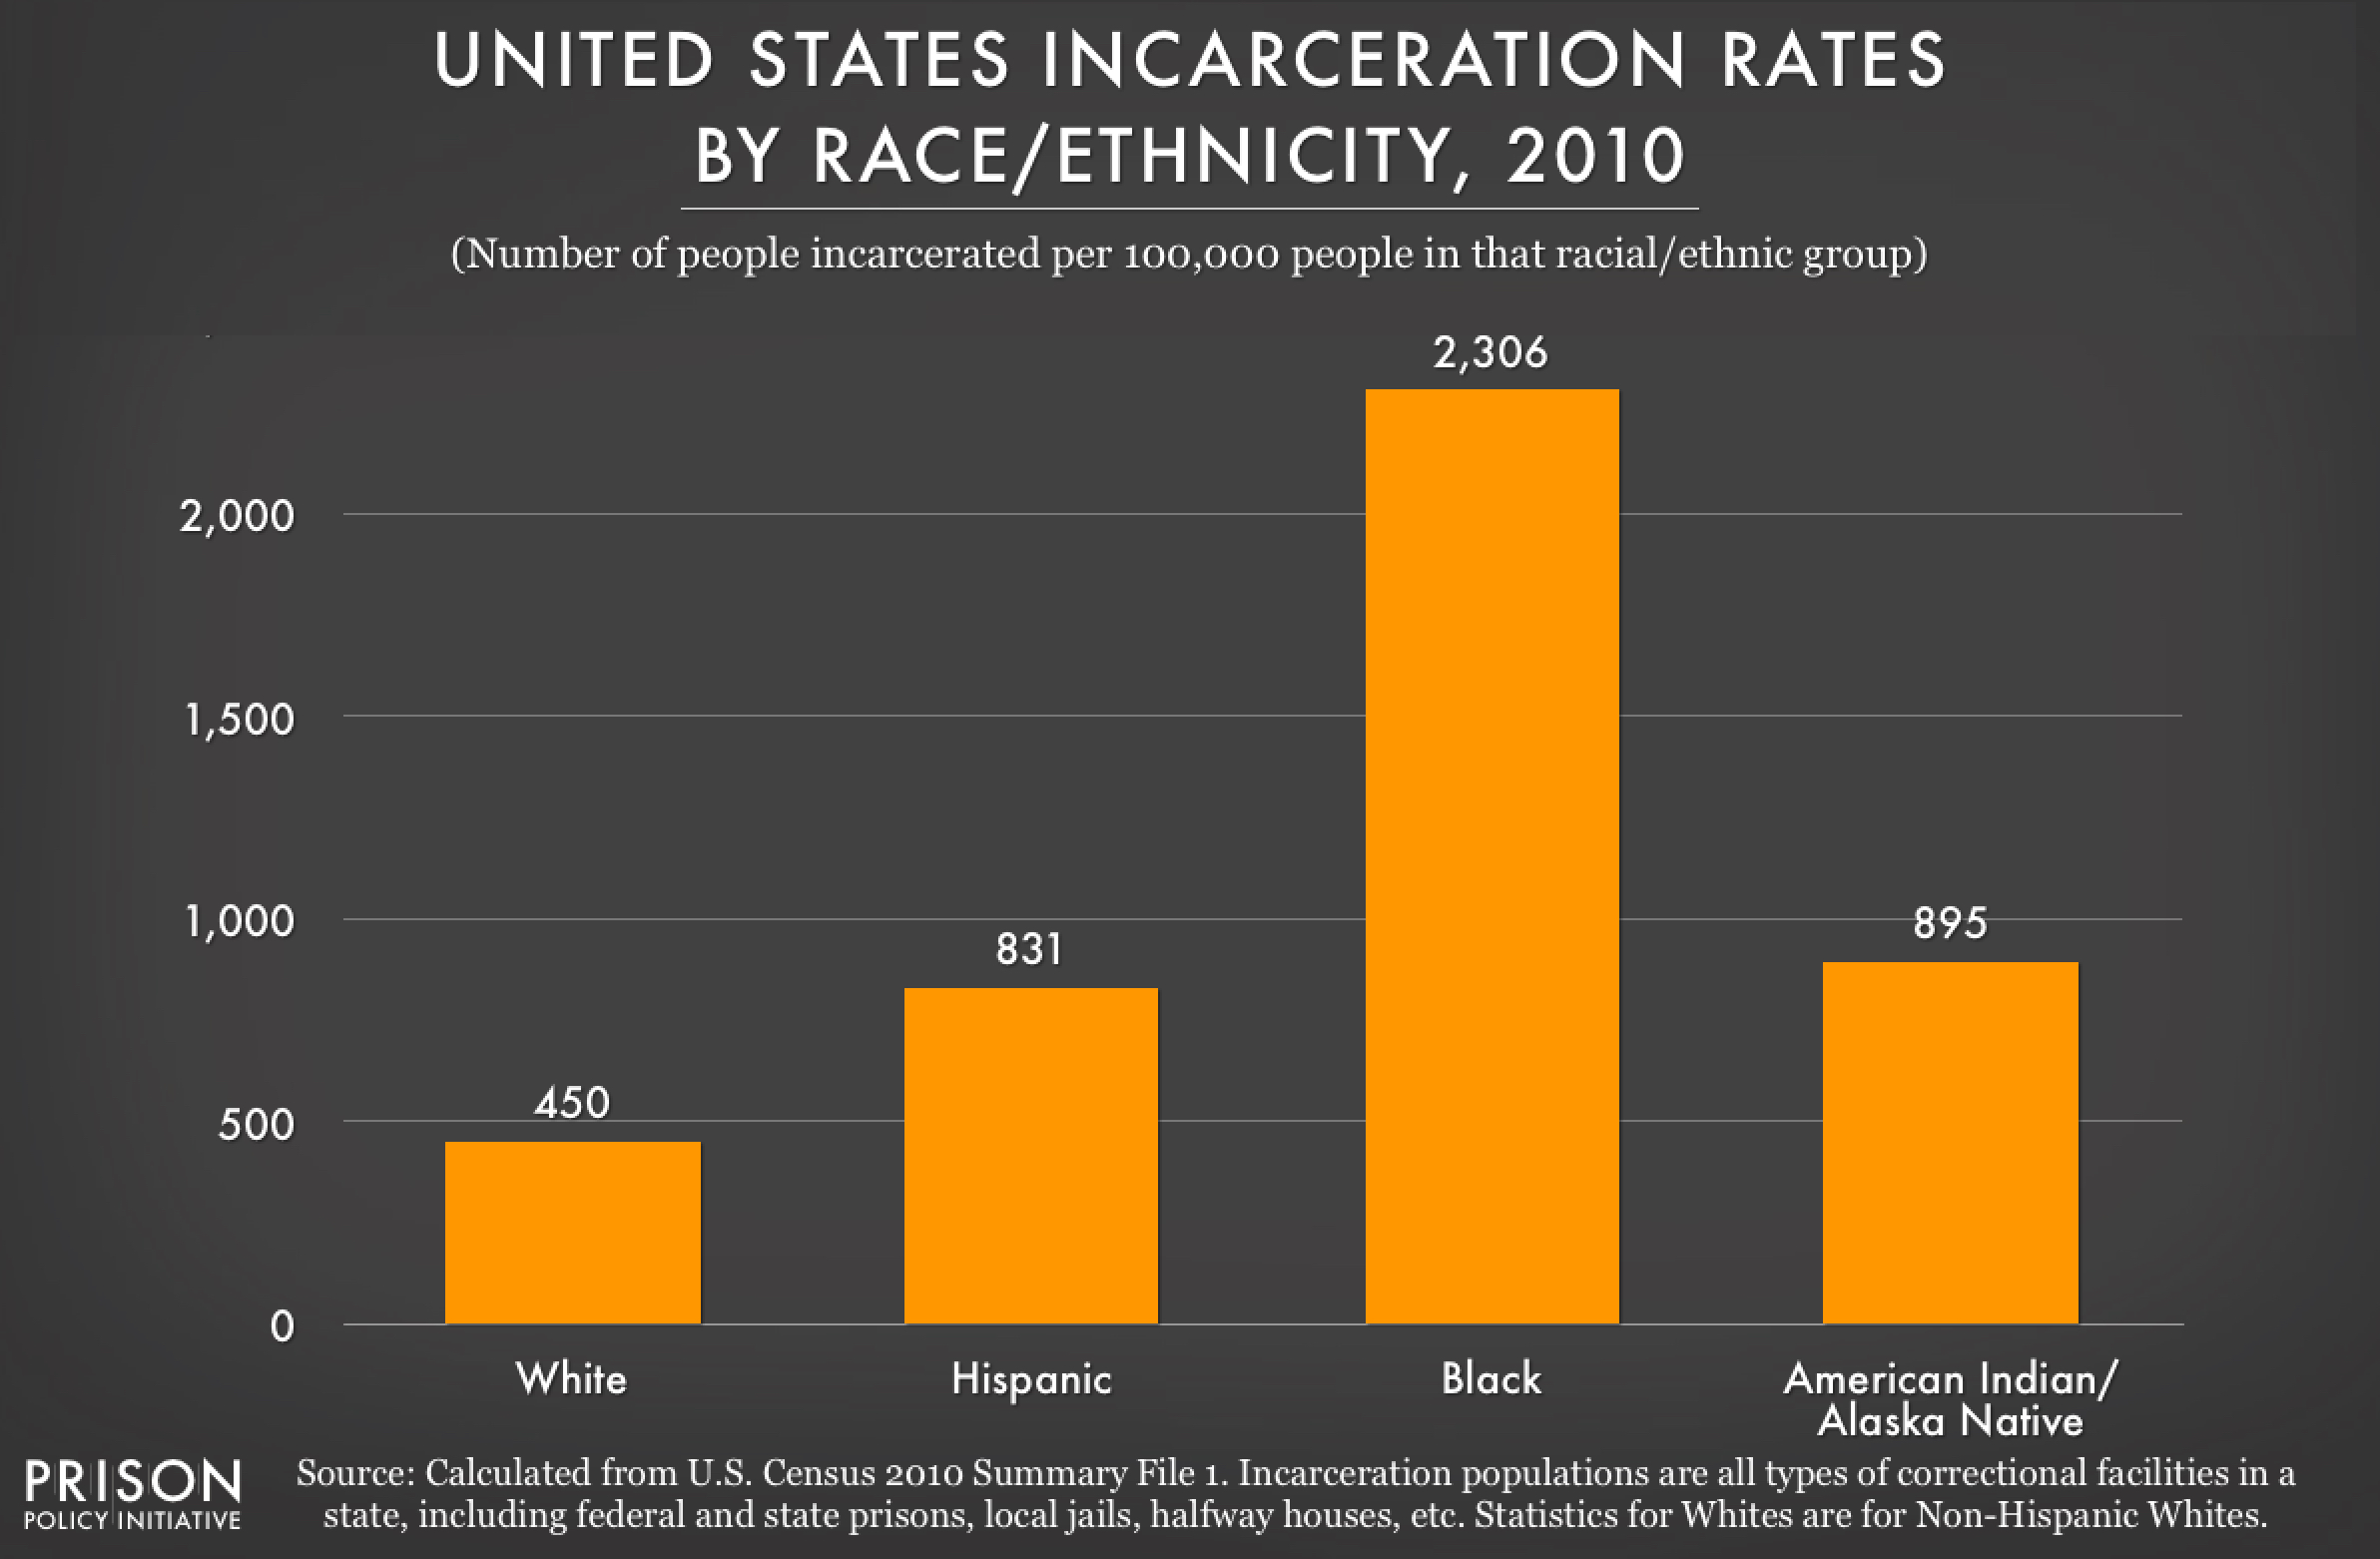
As we explain on our national profile page,
With over two million people behind bars at any given time, the United States has the highest incarceration rate of any country in the world.
We spend about $82.4 billion every year — not to mention the significant social cost — to lock up nearly 1% of our adult population. To be able to evaluate this policy choice, our communities must have access to reliable and up-to-date information about the trajectory and scope of our nation's experiment with mass incarceration. With this page, and the accompanying 50 State Incarceration Profile series, we hope bring some of the most important and under-discussed national facts into the public discourse.


