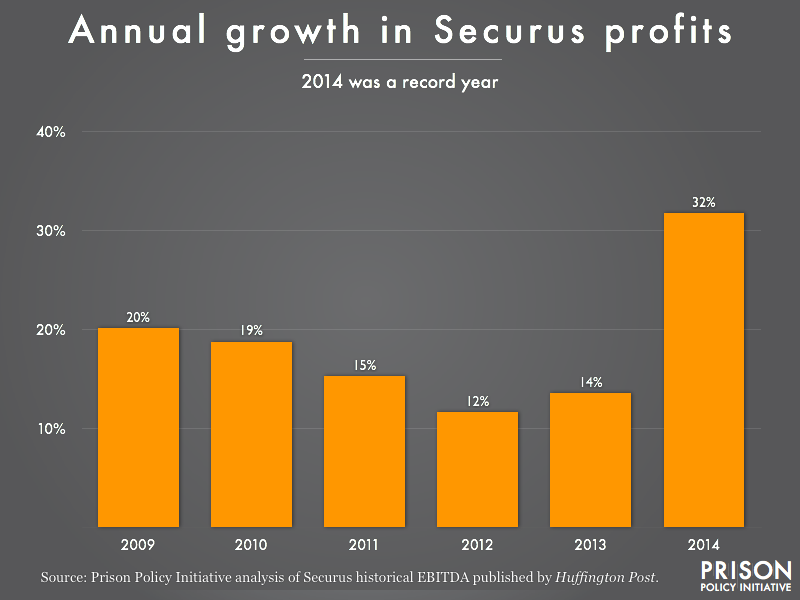
Data Source: Prison Policy Initiative analysis of Securus historical EBITDA published by The Huffington Post. (Graph: Peter Wagner, 2015)
This graph originally appeared in Uncovering Securus’ profits.
This graph shows the annual growth in Earnings Before Interest, Taxes, Depreciation and Amortization from 2009 to 2014 for Securus, showing a 32% increase in 2014.


