Hawaii profile
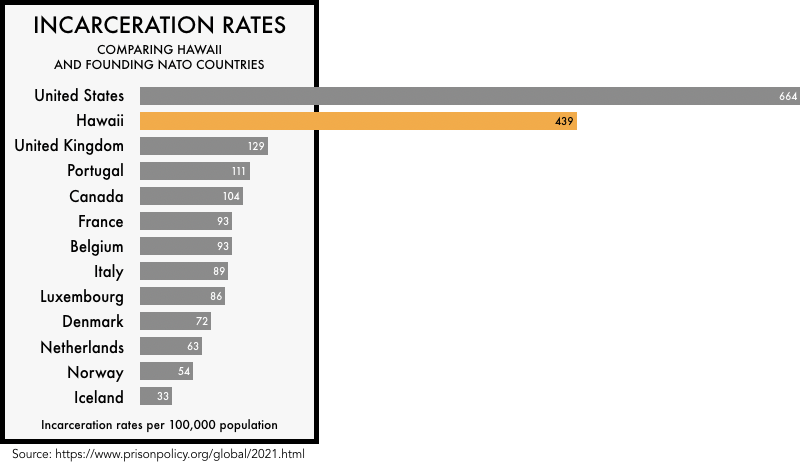
Hawaii has an incarceration rate of 439 per 100,000 people (including prisons, jails, immigration detention, and juvenile justice facilities), meaning that it locks up a higher percentage of its people than almost any democratic country on earth. Read on to learn more about who is incarcerated in Hawaii and why.
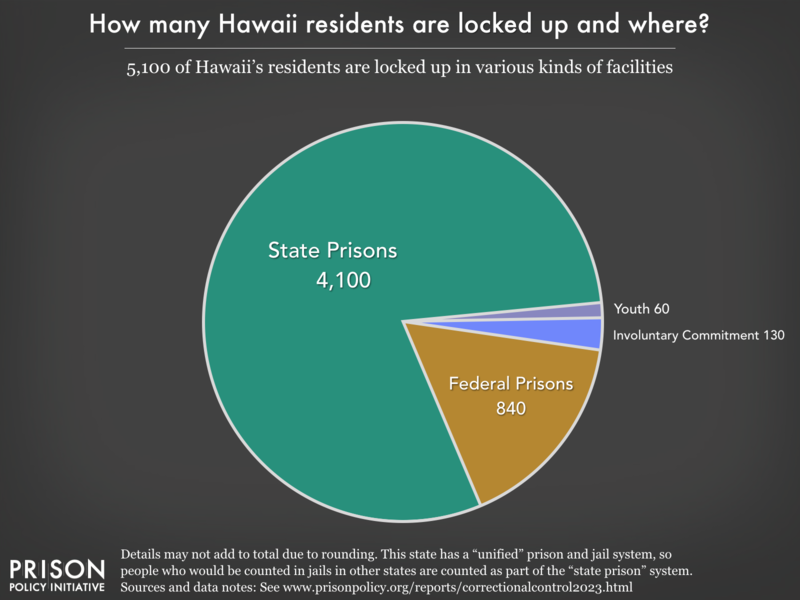
5,100 people from Hawaii are behind bars
Additionally, the number of people impacted by county and city jails in Hawaii is much larger than the graph above would suggest, because people cycle through local jails relatively quickly. Each year, at least 15,000 different people are booked into local jails in Hawaii.
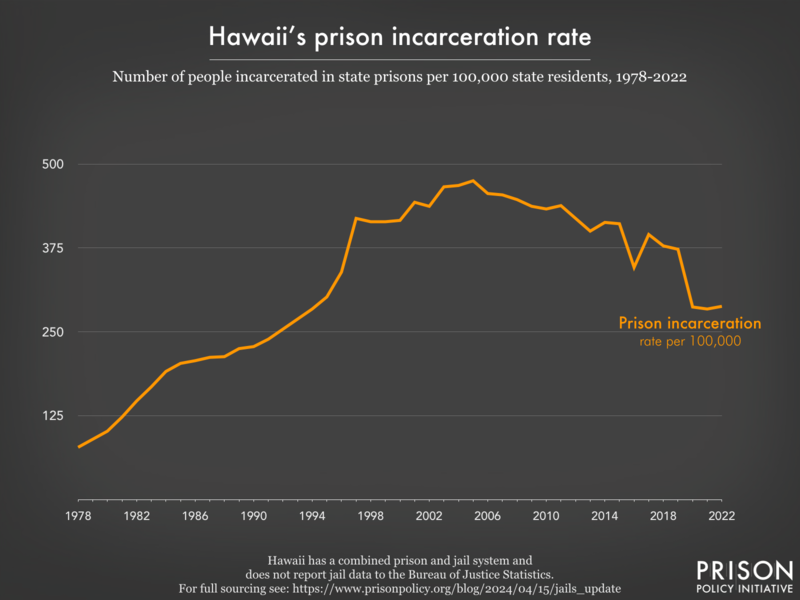
Rates of imprisonment have grown dramatically in the last 40 years
- total numbers rather than rates.
- Women’s prisons: Incarceration Rates | Total Population
- Men’s prisons: Incarceration Rates | Total Population
Today, Hawaii’s incarceration rates stand out internationally
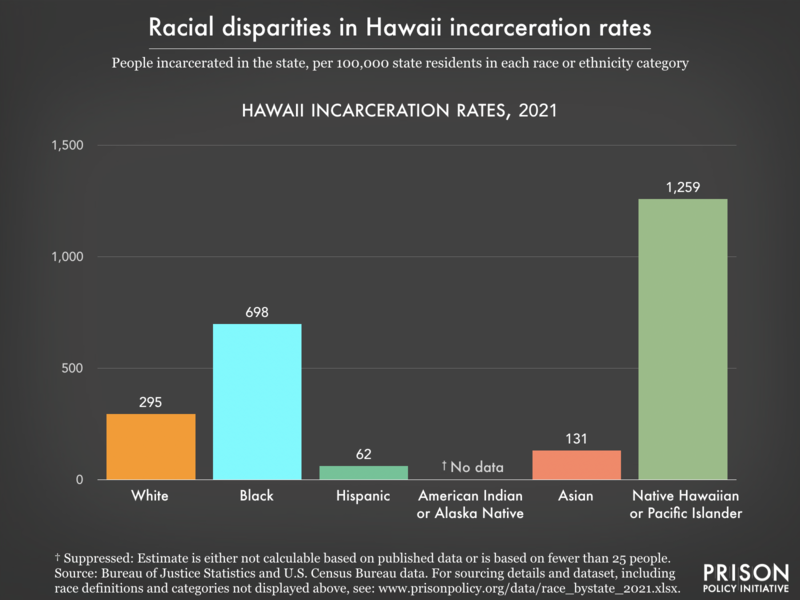
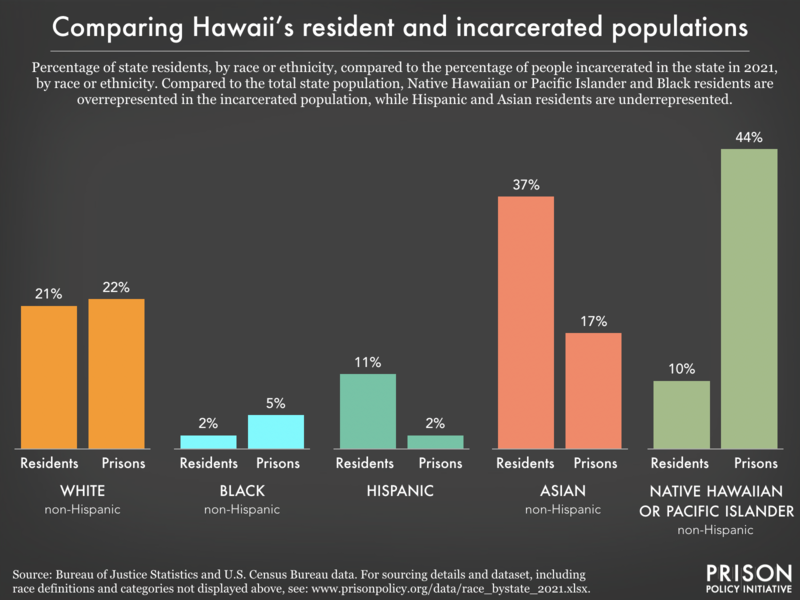
People of color are overrepresented in prisons and jails
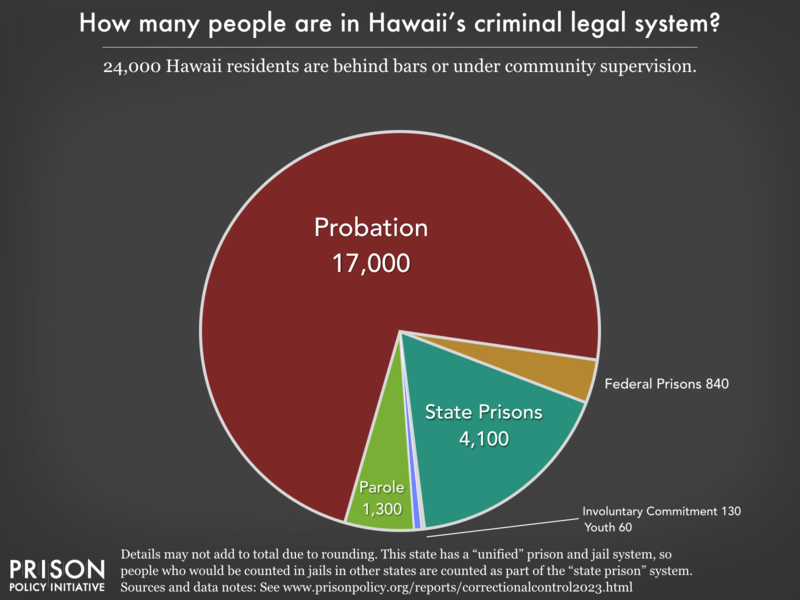
Hawaii's criminal justice system is more than just its prisons
Reports and briefings about Hawaii's criminal legal system:
Filter to show
- Hawaii releases roughly 1,408 men and 259 women from its prisons each year. What is it doing to support them upon reentry?
- People on parole in Hawaii can be sent back to prison for "associating" with anyone who has a felony or misdemeanor conviction — even loved ones who are trying to support them
- The parole board in Hawai’i is releasing 31% fewer people and holding 36% fewer hearings since the pandemic started
- Black people in Hawaii are incarcerated at a rate 2.4 times higher than white people.
- Hawaii's choice to criminalize "failure to appear" may be hurting public safety
- The cost of incarcerating older people is incredibly high, and their risk of reincarceration is incredibly low, yet 17% of people in Hawaii prisons are over the age of 55. Why is the state keeping so many older people locked up?
- Hawaii makes it difficult or even risky for incarcerated journalists to tell their stories.
- In Hawaii, 5,100 people are incarcerated and another 18,300 are on probation or parole.
- Hawaii passed a pilot caregiver proximity law to fund a visitation and family resource center for incarcerated parents and their children.
- Prisons in Hawaii charge up to $1.05 for a 15-minute phone call.
- Bail companies in Hawaii have a track record of avoiding accountability, our report All Profit, No Risk and review of state-by-state evidence show
- During the pandemic, Hawaii suspended medical copays for incarcerated people seeking treatment for COVID-like symptoms. It should end these copays completely.
- If a person in a Hawaii prison has more than $10 in their commissary account they likely will not qualify for assistance to purchase essentials like postage — but they’ll likely have to repay the state if they do receive assistance.
- Hawaii is among the few states that do not charge families to transfer money to an incarcerated loved one.
- With an incarceration rate of 439 per 100,000 residents, Hawaii locks up a higher percentage of its people than almost any democratic country on earth.
- We gave Hawaii a failing grade in September 2021 for its response to the coronavirus in prisons.
- Hawaii hurts jury diversity by excluding people with felony records
- How many COVID-19 cases in Hawaii communities can be linked to outbreaks in correctional facilities? (data from our report Mass Incarceration, COVID-19, and Community Spread)
- We graded the parole release systems of all 50 states - Hawaii gets a C+
- Hawaii incarcerates women at a rate of 112 per 100,000 residents — higher than almost any democratic country on earth.
- People in Hawaii prisons earn as little as 25¢ an hour for their work.
Other resources
- Research on Hawaii in our Research Library
Data notes:
Several factors lead us to believe that our analysis understates the extent of the disproportionate incarceration of Hawaii's Native Hawaiians. The Department of Public Safety (which runs the prison and jail system) says that the state's incarcerated population is 39% Native Hawaiian or part Native Hawaiian. Some organizations and individuals who work in the correctional facilites report higher numbers. Can the Census data shed new light on how many Native Hawaiians Hawaii incarcerates?
We find three data points that suggest that the Native Hawaiian people are inaccurately reflected in a lot of reported demographic data from both the state and the U.S. Census Bureau:
It matters how race/ethnicity data is collected, by whom and for what purpose. Often, the data collected by the Census Bureau on the race and ethnicity of incarcerated populations comes directly from correctional facility administrators, and so it will be compromised by any methodological shortfalls in the original data collection. For example, a person who identifies as Native Hawaiian and participates in Native cultural programming might have been classified by the administration as white without that person ever having been asked to self-identify. This problem is particularly important in the Native Hawaiian context because many Native Hawaiians are of more than one race, but many correctional systems are still collecting data under the antiquated conception that people can be of only one race. On the other hand, sometimes the Census Bureau collects its data directly from incarcerated people and we can get a new piece of data to compare with the correctional facilities' data.
Data variations suggest that the Census Bureau relied on Hawaii Department of Public Safety records for the race and ethnicity of incarcerated people in the 2010 Census, but may have directly enumerated incarcerated people in the 2000 Census in at least some facilities, which then allowed at least some incarcerated people to select more than once race.
Allowing people to select more than one race makes a large difference in the case of Native Hawaiians. Using our detailed analysis of the Halawa Correctional Facility, we can see that the U.S. Census was clearly conducted differently at this facility in 2010 than in 2000 in a way that moved people of more than one race into single-race categories:
Native Hawaiian or other Pacific Islander alone Native Hawaiian and Other Pacific Islander in combination with other racial groups Native Hawaiian alone or in combination with other racial groups More than one race (of any kind) Halawa Correctional Facility, 2000 Census 24.5% 31.3% 55.8% 40.0% Halawa Correctional Facility, 2010 Census 43.6% 1.5% 45.1% 2.3% And, although the Census Bureau doesn't break down the demographics beyond "Native Hawaiian and other Pacific Islanders," Native Hawaiians are a vast majority (85%) of the Native Hawaiian and Other Pacific Islander population incarcerated by the department. (In 2008, the department reported that its population was 39% Hawaiian/Part Hawaiian, 5% Samoan, and 2% "Other Pacific Islander.")
Clearly, there were more people labeled "Native Hawaiian or Pacific Islander alone" at Halawa prison in 2010 than there were in 2000, but the dramatic difference in the number of people reported as being of more than one race raises many questions. As the data from the federal facility (in point #2 below) suggests, the answer is unlikely to be a massive change in the race of people sent to prison.
While the above comparison focuses on Halawa, we found other correctional facilities in the 2000 Census where we could determine (because the facility was the entirety of its block) the portion of the incarcerated population that was Native Hawaiian and Pacific Islander:
Facility Native Hawaiian/Pacific Islander or Native Hawaiian/Pacific Islander and other racial groups Halawa Correctional Facility 55.8% Waiawa Correctional Facility 52.8% Kauai Com Correct Center 42.7% Other researchers may find those figures useful.
- Properly counting people of more than one race is particularly important in Hawaii because so many Native Hawaiians are of more than one race. According to the U.S. Census Bureau, "Of all respondents who reported Native Hawaiian, 70 percent reported one or more other races and/or detailed NHPI groups." (Source: The Native Hawaiian and Other Pacific Islander Population: 2010, p. 17.)
While the population in correctional facilities could be very different than the national Native Hawaiian and Other Pacific Islander statistics, the 2010 U.S. Census counts of a federal facility in Hawaii suggest that the difference seen between 2000 and 2010 in the state correctional facilities was the result of data collection practices and not sudden changes in the racial makeup of the incarcerated people. (The Federal Detention Center Honolulu, is a federal detention center, but also holds some of the state's incarcerated population under contract with the Department of Public Safety.)
Native Hawaiian or other Pacific Islander alone Native Hawaiian and Other Pacific Islander in combination with other racial groups Native Hawaiian alone or in combination with other racial groups More than one race (of any kind) Federal Detention Center Honolulu, 2010 Census 21.0% 27.3% 48.3% 34.9%
The state Halawa prison reported almost no one of more than one race and the federal facility reported that 35% of the facility was of more than once race. This large difference is likely due to data collection differences rather than population differences. - A large portion of Hawaii's prison population is sent out-of-state, and that population is disproportionately Native Hawaiian. Because the Census Bureau counts people where they are confined, both the incarceration rate for Native Hawaiians and the portion of the prison population that is Native Hawaiian is underreported in these graphs. In 2010, Office Of Hawaiian Affairs released a report The Disparate Treatment of Native Hawaiians in the Criminal Justice System finding that Native Hawaiians were disproportionately sent to out-of-state prisons. The report said that in 2005, "of the people in out-of-state facilities, 41 percent are Native Hawaiians". The numbers may have gotten worse, as our our analysis of the Census Bureau data for Arizona's Saguaro Correctional Facility says that that facility is 48% Native Hawaiian alone, and 49% Native Hawaiian alone or in combination with other racial groups.
