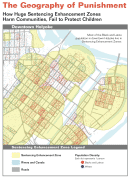
The Geography of Punishment:
How Huge Sentencing Enhancement Zones Harm Communities, Fail to Protect Children
by Aleks Kajstura, Peter Wagner, and William Goldberg
Prison Policy Initiative
July 2008
Section:
Appendix G. Demographic analysis of populations living in recommended 100-foot enhancement zones.
| Population | Percentage within recommended zones | |||||||
|---|---|---|---|---|---|---|---|---|
| Total | White | Black | Latino | Total | White | Black | Latino | |
| Agawam | 1,499 | 1,443 | 9 | 25 | 5.3% | 5.4% | 3.2% | 4.9% |
| Blandford | 87 | 83 | 2 | 0 | 7.2% | 6.9% | 22.9% | 7.5% |
| Brimfield | 123 | 121 | 0 | 1 | 3.7% | 3.7% | 0% | 1.6% |
| Chester | 19 | 18 | 0 | 0 | 1.4% | 1.4% | 5.0% | 2.4% |
| Chicopee | 3,807 | 3,054 | 177 | 498 | 7.0% | 6.4% | 13.6% | 10.4% |
| East Longmeadow | 454 | 435 | 2 | 9 | 3.2% | 3.2% | 1.7% | 7.2% |
| Granville | 41 | 37 | 0 | 0 | 2.7% | 2.4% | 0% | 1.0% |
| Hampden | 53 | 52 | 0 | 0 | 1.0% | 1.0% | 1.5% | 0.6% |
| Holland | 39 | 37 | 1 | 0 | 1.6% | 1.6% | 10.0% | 0% |
| Holyoke | 4,143 | 1,924 | 123 | 2,011 | 10.4% | 8.9% | 10.3% | 12.2% |
| Longmeadow | 1,183 | 1,114 | 9 | 11 | 7.6% | 7.5% | 7.4% | 6.7% |
| Ludlow | 689 | 658 | 4 | 17 | 3.5% | 3.5% | 4.3% | 5.7% |
| Monson | 211 | 201 | 1 | 7 | 2.5% | 2.5% | 0.9% | 6.6% |
| Montgomery | 0 | 0 | 0 | 0 | 0% | 0% | n/a | 0% |
| Palmer | 378 | 359 | 2 | 6 | 3.0% | 3.0% | 2.0% | 3.9% |
| Russell | 93 | 92 | 0 | 1 | 5.6% | 5.7% | 0% | 2.8% |
| Southwick | 472 | 451 | 3 | 13 | 5.3% | 5.3% | 4.0% | 8.5% |
| Springfield | 11,419 | 5,427 | 2,415 | 3,314 | 7.5% | 7.3% | 7.6% | 8.0% |
| Tolland | 44 | 43 | 0 | 0 | 10.2% | 10.5% | 0% | 0% |
| Wales | 160 | 155 | 2 | 1 | 9.2% | 9.1% | 10.7% | 12.7% |
| West Springfield | 1,448 | 1,301 | 39 | 77 | 5.2% | 5.3% | 6.1% | 4.8% |
| Westfield | 2,160 | 1,945 | 22 | 158 | 5.4% | 5.3% | 5.2% | 7.9% |
| Wilbraham | 410 | 391 | 6 | 4 | 3.0% | 3.0% | 3.3% | 2.0% |
| Hampden County | 28,931 | 19,341 | 2,815 | 6,153 | 6.4% | 5.7% | 7.7% | 9.0% |
Recommended Reading:

Why are calls from prisons and jails so expensive?
We look at the progress in the fight for phone justice and what comes next.
Research Library
We curate a searchable database of 4,000+ original research reports, organizing each entry by topic and adding brief summaries.

Mass Incarceration: The Whole Pie
The U.S. incarcerates over 1.9 million people, more than any other country. Where are they locked up and why? Read our report.

Jails and bail: Our research
One out of three people behind bars is in a local jail. Our research drives jail reform.