Donate
 The Geography of Punishment:

How Huge Sentencing Enhancement Zones Harm Communities, Fail to Protect Children
by Aleks Kajstura, Peter Wagner, and William Goldberg
Prison Policy Initiative
July 2008
Section:
- Sections:
- Introduction
- Deterrence, in Theory and Practice
- Failing to protect children, harming communities
- Missing the mark on children’s involvement with drugs
- Failing to move drug dealers away from schools
- An ‘urban effect’: Interlocking sentencing enhancement zones blanket urban areas and barely touch rural populations
- Sentencing enhancement zones create an unjustifiable ‘urban effect’
- Disproportionate impact on minority residents
- Disproportionate impact on poor residents
- Mandatory minimums often mean large sentences for small offenses
- Recommendations
- Methodology
- Acknowledgments
- About the authors
- Endnotes
Introduction
Massachusetts currently enforces a strict mandatory minimum sentence for certain drug offenses committed near schools and parks. Originally adopted in 1989 and expanded twice,[1] the law is one of many statutes aimed at protecting children by steering drugs and related harmful behaviors away from areas where children congregate.
The sentencing enhancement zone laws have mostly escaped public scrutiny, despite a growing body of evidence that the zones fail to protect children and that defendants are often eligible for the mandatory minimums based on their places of residence, not the severity of their offenses.
Though the statute aims to protect children, its patterns of conviction indicate that it has more effectively created a two-tiered system of drug sentencing in Massachusetts. Because schools are more numerous in dense urban areas, most urban residents — including most of the state’s Black and Latino residents — face longer mandatory minimum sentences for drug offenses than the state’s rural residents, who are predominantly White.
This human cost is accompanied by a staggering fiscal cost. By continuing to enforce the sentencing enhancement zone law, the Commonwealth is spending huge sums to incarcerate minor drug offenders who were not endangering children: the 727 people in prison or jail for zone violations are approximately 3.1% of the state’s incarcerated population. It costs $43,025.63 per year to incarcerate a drug addict and $4,970 per year to treat him.[2] Confining these addicts costs the state more than $31 million a year, when it would cost much less to help them more effectively.[3] This enormous cost excludes the unknowable number of people who pled guilty to zone charges to avoid the mandatory minimum. As the state’s budget deficit is predicted to surpass $3 billion,[4] it is both ethically and fiscally necessary to reform legislation that incarcerates large numbers of people for long periods for minor offenses.
This report examines the geography of the areas covered by Massachusetts’ sentencing enhancement zone law. We set out to answer two questions:
- Does the sentencing enhancement zone law punish certain populations more harshly because of where they live?
- Is 1,000 feet a logical or effective distance for a geography-based sentencing enhancement?
Our mapping work focuses on Hampden County, which is located in the western part of the state and contains the cities of Holyoke and Springfield, as well as very rural towns like Tolland and Blandford. As a percentage of its total population, the county has the second largest minority population in the state, after Suffolk County (Boston). It also has the second highest poverty rate in the state, the highest poverty rate for children under 5, and the third highest rate of adults without a high school diploma or GED.[5]
Despite these pressing needs, much of the state’s investment in Hampden County goes to criminal justice. Hampden County is twice as likely to charge its citizens with drug offenses as the state as a whole,[6] and according to the most recent data available, uses the sentencing enhancement zone law more than any other county: two and half times the state average. (See Table 1.)
| District Court Drug Charges (FY1998) | District Court Drug Charges per 1000 People | Sentencing Enhancement Zone Convictions (FY1998) | Sentencing Enhancement Convictions per 1000 Drug Charges | |
|---|---|---|---|---|
| Barnstable | 1,095 | 5 | 0 | 0 |
| Berkshire | 622 | 4 | 9 | 14.2 |
| Bristol | 5,204 | 10 | 14 | 2.7 |
| Dukes | 122 | 9 | 0 | 0 |
| Essex | 6,221 | 9 | 23 | 3.7 |
| Franklin | 330 | 5 | 0 | 0 |
| Hampden | 6,760 | 15 | 108 | 16.0 |
| Hampshire | 723 | 5 | 0 | 0 |
| Middlesex | 6,027 | 4 | 42 | 7.0 |
| Nantucket | 30 | 4 | 0 | 0 |
| Norfolk | 2,477 | 4 | 6 | 2.4 |
| Plymouth | 3,074 | 7 | 26 | 8.4 |
| Suffolk | 11,559 | 18 | 75 | 6.5 |
| Worcester | 6,191 | 8 | 13 | 2.1 |
| TOTAL/AVG | 50,435 | 8 | 316 | 6.3 |
While it is outside the scope of this report to explain the differences in zone enforcement between Hampden County and the state as a whole, the county’s internal diversity and frequent use of the zone law make it an ideal place to study the geography and demography of the enhancement zones.
According to the most comprehensive national report on sentencing enhancement zones, Disparity by Design, almost every state has its own version of the enhancement zone law.[7] Massachusetts’ 1,000-foot distance is the most common, but the zones’ size, the locations they surround, and other specifics vary greatly.
The Massachusetts law requires that the distance be measured in a straight line from the property line of the school or other designated area. The offender need not know he is in a zone to face an enhanced penalty, and adjoining unused school-owned land also qualifies as school property. The law operates regardless of whether school is in session or children are present. In Massachusetts and most states, the sentencing enhancement must be served separately from the sentence for the underlying offense. Massachusetts’ mandatory minimum sentence is 2 or 2 1/2 years depending on whether the defendant is charged in District or Superior Court.
Deterrence, in Theory and Practice
The intent of sentencing enhancement zone laws is simple: to encourage drug dealers to stay away from children, thereby protecting children from drugs and drug-related behavior. Governor Michael Dukakis proposed the law in 1989, saying that “we want kids to be able to go to school without running the gauntlet of drug pushers.”[8]
Geography-based deterrence laws increase the penalty for offenses committed within specified zones, with the goal of encouraging people to move out of the zone before committing the offenses. Massachusetts courts have ruled that the sentencing enhancement applies regardless of whether a defendant knew he was inside a zone.[9] This interpretation may be constitutional, but it is neither wise nor effective: if an offender is expected to avoid the zones, he must have a reasonable idea of where they are. In order for the zone law to be an effective deterrent, zones cannot cover the majority of a populated area, so the offender may choose to leave the zone without inadvertently entering another. They also need to be identifiable, so that an offender can stay outside them in the first place. The Massachusetts law fails on both counts.
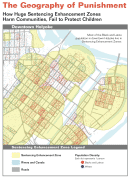
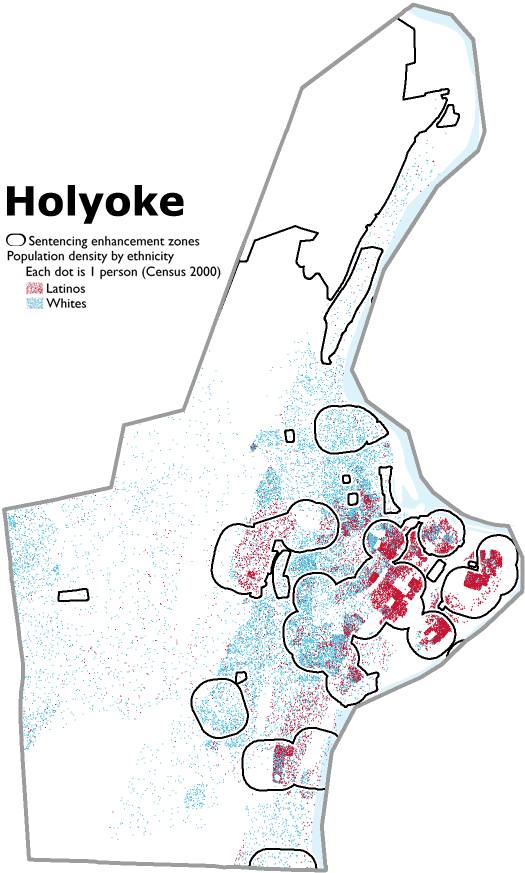
The zones are so large that they overlap, imposing an enhanced penalty on massive areas, sometimes entire cities. When a zone covers huge amounts of land, including many properties that are not schools, it does not encourage offenders to move away from schools. The problem of overlap is especially pronounced in urban areas, where schools and other relevant facilities are numerous and close together. The New Jersey Commission to Review Criminal Sentencing, which found that three-quarters of Newark was in an enhancement zone, has termed this problem the “urban effect.”[10] The map of downtown Holyoke on the cover of this report demonstrates how zone overlap covers entire communities. There is no written record clarifying the legislature’s reasoning for setting the zones at this particular distance.
A distance of 1,000 feet is extremely difficult to estimate reliably, making it difficult to infer where the zones are, but it is also often impossible to determine whether a particular location — particularly an urban one — is near a school at all. The statute’s original bill mandated that the zones’ borders be marked with “drug-free zone” signs,[11] but the provision was dropped.[12] When zones cannot be determined using common sense, an offender who wants to move to a non-zone area will be unable to do so. A statute that creates such a situation is by no means an effective deterrent.
An offender unable to distinguish between zone and non-zone areas will not move away from a school because he cannot find a non-zone area to move to. As it is, property lines of schools are unmarked and often far from obvious, and because of buildings or natural formations, a school may be invisible to someone walking near it. An enhancement zone, then, can be used to punish someone who had no intention of selling drugs to children and was, for practical purposes, nowhere near them.
In preparation for this report, we decided to determine how far 1,000 feet actually is. As illustrated above, the statute’s requirement that the distance be measured in a straight line, regardless of obstruction, puts many distant areas under the law’s jurisdiction. We set out to discover whether, under ideal circumstances, people can be seen 1,000 feet from a school and found that at 1,000 feet, a person is an almost-invisible speck. It is therefore unreasonable to assume that someone anywhere within 1,000 feet of school property intends to sell drugs to children at the school. (See photos in the sidebar 1,000 feet is further than you think.)
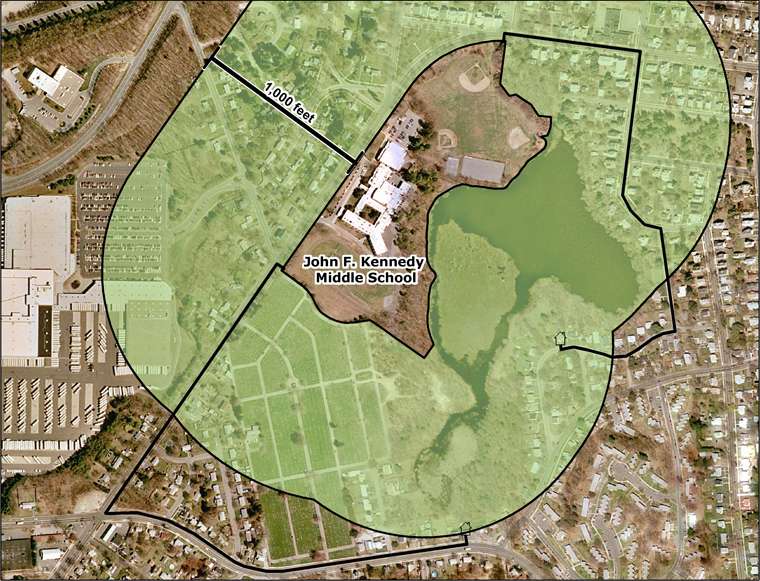
Figure 1. Because of a large pond, a cemetery and the roads’ arrangement, a person on Darling Street would need to travel 3,200 feet to get to the closest part of the JFK Middle School property, and a person on Page Boulevard would have to travel 3,800 feet to reach it. Yet the law requires that the sentencing enhancement zone distance be measured in a straight line from the edge of the property, regardless of the obstacles in between.
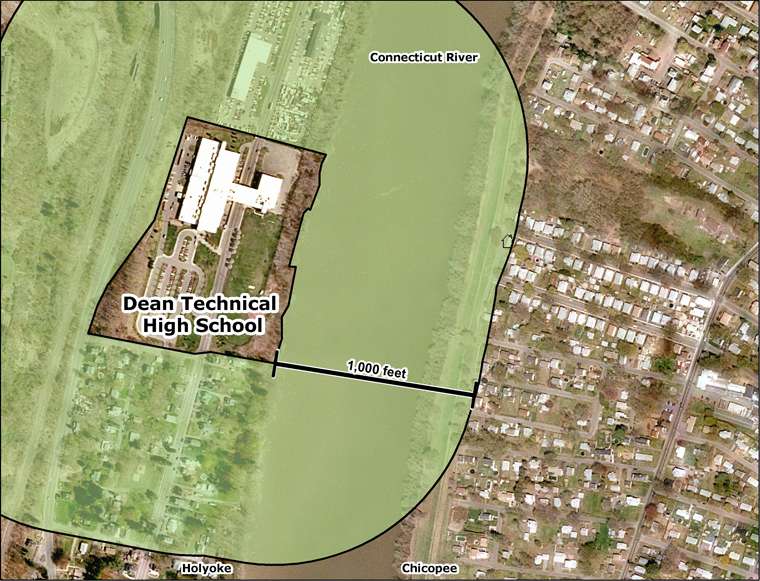
Figure 2. 1,000-foot zones are so large that the zone around Holyoke’s Dean Technical High School crosses the Connecticut River and reaches Chicopee. The driving distance from Bonner Street in Chicopee to the Technical High School in Holyoke is 4.4 miles and would take about 11 minutes.
Failing to protect children, harming communities
When the Massachusetts legislature passed the sentencing enhancement law in 1989 and expanded it in 1993 and 1998, it did so in pursuit of the valuable goal of keeping drugs away from children. But good intentions alone do not make good law, and the law’s fundamental assumptions shows that legislators built something that was more comforting than effective.
Missing the mark on children’s involvement with drugs
It is likely that legislators assumed that the 1,000-foot distance was small enough that any person selling within it intended to sell to children. Our experiment demonstrates that a 1,000-foot distance is so large that one person may not even be able to effectively communicate with another. Furthermore, according to the 2004 National Survey on Drug Use and Health, a survey conducted by the federal government, children who use drugs most frequently use marijuana,[13] and most often obtain it from friends, not strangers.[14]
Massachusetts does not publish data on whether children are present in zone offenses, but other studies suggest that children are present in few cases, if any. William Brownsberger’s study on drug dealing cases in Fall River, New Bedford and Springfield found that less than 1 percent involved charges of dealing to minors or using minors in sales.[15] He told the Boston Globe that “[i]n no cases did we have the classic picture of the pushers standing on the corner offering 5th graders their first introduction to drugs.”[16]
Failing to move drug dealers away from schools
If enhancement zone laws effectively deterred drug dealers from selling drugs inside the zones, one would expect to find drug dealers immediately outside the zones’ borders, because dealers would move just enough to avoid the enhanced penalty charge. Research in Massachusetts and New Jersey shows no evidence of such movement. The New Jersey Commission to Review Criminal Sentencing found that less than 9% of drug arrests are made between 1,000 and 1,200 feet from schools.[17] Brownsberger’s Massachusetts study found that drug dealing was denser inside school zones than outside them.[18] The New Jersey Commission, examining arrests near schools before and after the legislation’s passage, came to a similar conclusion: instead of dropping as offenders were deterred, the general trend of arrests inside the zones was “strongly upward.”[19] Both the New Jersey Commission and Brownsberger concluded that the 1,000-foot distance is the cause of the law’s failure to move drug dealers away from schools and suggested reducing the zones to a more easily recognizable distance of about 200 feet.[20]
Though it fails to move drug offenders away from schools, the statute’s mandatory minimum is often used to expedite guilty pleas from those who commit low-level drug offenses. While simple possession does not trigger the zone enhancement, the law applies to both drug dealing and “possession with intent to distribute,” which the statutes do not explicitly define. Prosecutors, then, have a great deal of latitude to argue that drug users intend to sell recently-purchased drugs. This flexibility has resulted in an alarming racial disparity: a Northeastern University study of drug charges in the Dorchester District Court found that minority defendants were four times as likely to be charged with drug dealing as White defendants.[21]
Prosecutors have an incentive to pursue drug possession cases as “possession with intent to distribute” cases because that charge makes the defendant subject to the two-year mandatory minimum. Prosecutors routinely drop the zone charge — and its mandatory minimum sentence — in exchange for a guilty plea. As a result of this practice, only a small percentage of zone charges lead to zone convictions.[22] This, however, leads to longer sentences than would otherwise be served for the lowest level non-violent drug offenders.
An ‘urban effect’: Interlocking sentencing enhancement zones blanket urban areas and barely touch rural populations
The law’s poor construction also means that sentencing enhancement zone eligibility has less to do with one’s offense than the location of one’s home. Because they tend to live in urban areas and therefore more often live inside the zones, greater numbers of Blacks, Latinos and the poor are charged with zone violations than Whites who commit the same offenses. Additionally, because the statute dictates a two-year minimum sentence, judges are denied discretion in sentencing and must hand down punishments that are often disproportionate to the crimes committed.
Sentencing enhancement zones create an unjustifiable ‘urban effect’
In his Massachusetts study, Brownsberger found that most drug dealers are arrested near their homes, and that 73% of the defendants in enhancement zone cases lived within a zone.[23] In effect, the zone law frequently gives defendants an enhanced sentence because of where they live. Our analysis of Census Bureau data and the geography of Hampden County enhancement zones found that 36% of the county lives in a zone, but this population is disproportionately located in cities.
Our study of Hampden County found that residents of urban cities and towns are five times as likely to live in a sentencing enhancement zone as rural residents. The New Jersey Commission to Review Criminal Sentencing, which noticed a similar pattern in New Jersey, calls this phenomenon the “urban effect.” In Hampden County’s nine most urban cities and towns, 40% of the population lives in enhancement zones.[24] In the nine most rural towns, however, only 8% of the population does.[25] Though Census 2000 counted 121 school-age children in the town of Montgomery, for example, the town is so rural it contains no schools and few parks; none of Montgomery’s residents lives in an enhancement zone.
The evidence on children’s drug use does not justify an enhanced penalty for drug crimes committed in urban areas. Although the National Household Survey on Drug Use reports a small disparity in drug use between metropolitan and non-metropolitan adults, the federal survey reports that urban and rural children aged 12-17 use drugs at the same rates.[26] Drug usage is just as prevalent among rural schoolchildren, but urban communities receive the burden of the enhanced penalties.
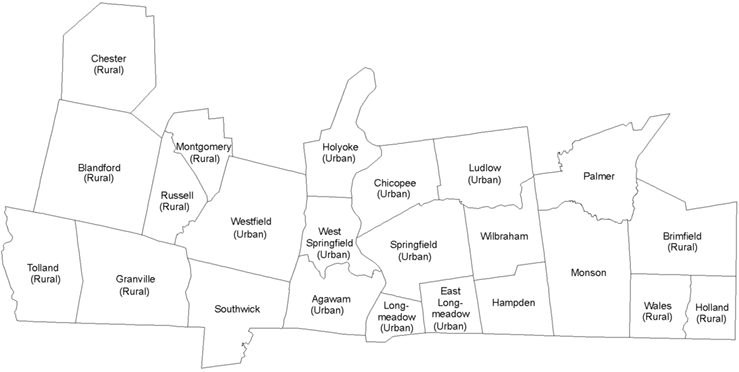
Figure 3. The cities and towns of Hampden County.
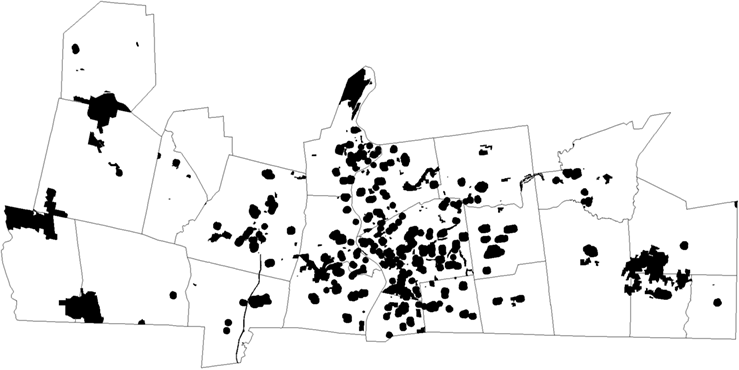
Figure 4. Hundreds of sentencing enhancement zones intersect, making drug defendants in urban communities subject to penalties not applied to defendants in rural areas, where the zones are infrequent. (The large zones in the rural areas are caused by state parks where few, if any, people actually live.)
Disproportionate impact on minority residents
Hampden County’s nine most rural towns are 97% White, while its nine most urban cities and towns are 71% White, 9% Black, and 17% Latino. Because Blacks and Latinos are more likely to live in urban areas, a law that enhances the sentences of urban residents does more harm to Black and Latino populations than to Whites.
Our analysis found that less than a third (29%) of White Hampden County residents live in enhancement zones, but that more than half (52%) of Black and Latino residents live in school zones. The difference exists even within cities and towns. In Holyoke, 45% of Whites live in zones, compared with 76% of Holyoke Latinos.
This racial disparity in the populations covered by sentencing enhancement zones is a large part of why almost 8 out of 10 people convicted of zone offenses in Massachusetts are Black or Latino.
While it is commonly known that the nation’s criminal justice system disproportionately incarcerates Blacks and Latinos, the Massachusetts sentencing enhancement zone law exacerbates the problem. Blacks and Latinos are only 12% of the state’s population, but 58% of the state’s prison population. Of those convicted of zone violations in 2004, 79% were Black or Latino. (See Table 2.)
| White | Black | Latino | |
|---|---|---|---|
| Massachusetts population | 82% | 6% | 7% |
| County jail population | 56% | 22% | 19% |
| State prison population | 44% | 27% | 27% |
| School zone convictions | 20% | 35% | 44% |
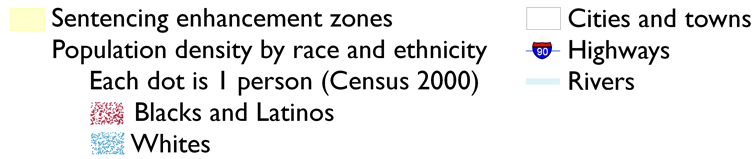
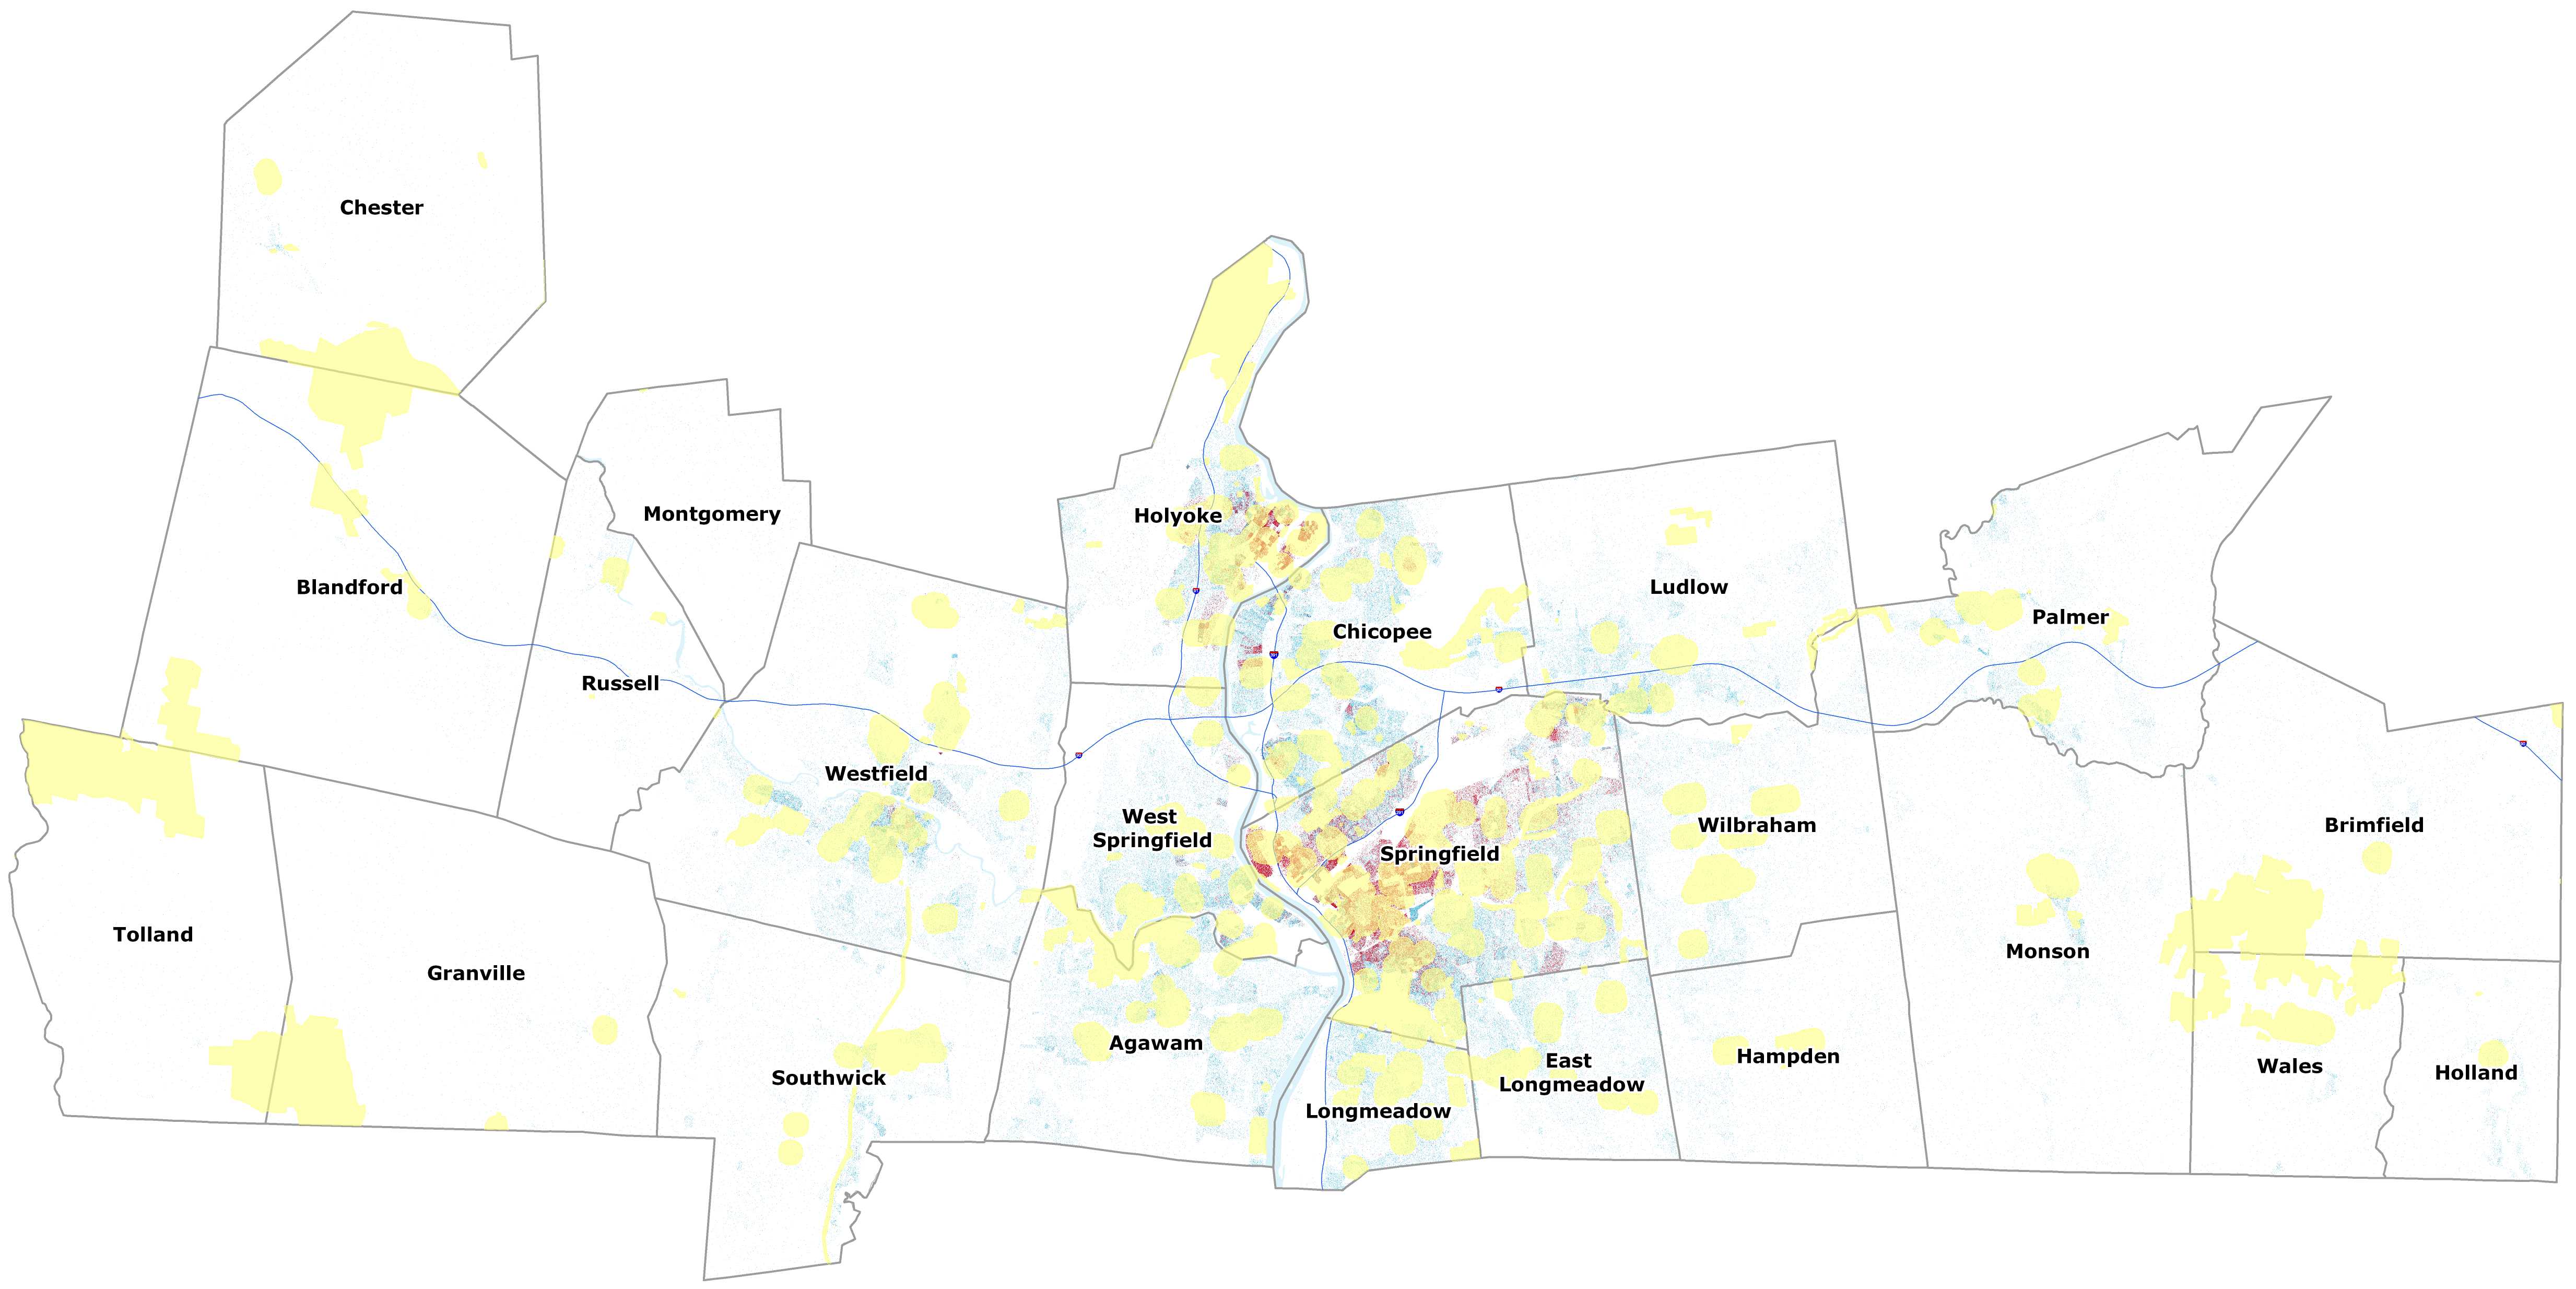
Figure 5. This large scrolling map of Hampden County shows how sentencing enhancement zones disproportionately affect urban, Black and Latino populations. The Black and Latino populations are represented with red dots, and the White population with blue dots. The Black and Latino populations are heavily concentrated in urban areas, where the majority of the population lives in school zones. You can quickly navigate to each town with these links: Agawam Blandford Brimfield Chester Chicopee East Longmeadow Granville Hampden Holland Holyoke Longmeadow Ludlow Monson Montgomery Palmer Russell Southwick Springfield Tolland Wales West Springfield Westfield or Wilbraham.
| Total population | White | Latino | Percent of White population living in zones | Percent of Latino population living in zones | |
|---|---|---|---|---|---|
| Holyoke | 39,838 | 21,508 | 16,485 | 45.2% | 75.7% |
Figure 6. Holyoke has a higher percentage of Whites and Latinos in school zones than any other city or town in Hampden County. But Latinos (red dots) are still far more likely than Whites (blue dots) to live in a zone and be subject to the enhanced penalty.
Disproportionate impact on poor residents
The Legislature amended the sentencing enhancement zone law in 1998 to put 1,000-foot zones around accredited daycare and Head Start facilities. Our analysis found that adding Head Start facilities, which are located in low-income neighborhoods and specifically serve low-income families, disproportionately magnified the impact of the law on poor defendants.
Half of the people living below the poverty line in Hampden County live in an enhancement zone. More than 20% of the people living in zones are poor, but only 11% of the people living outside the zones are poor. Forty percent of the county’s population without a high school degree or GED lives in an enhancement zone.
Mandatory minimums often mean large sentences for small offenses
In addition to disproportionately affecting urban, minority, and poor offenders, the law is so broad that populations who have not and would not sell drugs to children are receiving punishments aimed at those who do. Massachusetts judges who have noticed this discrepancy between sentence and offense have been working against the statute for several years.
In 1995, the Boston Globe surveyed 37 Massachusetts judges and found that nearly all agreed that “he or she has had to sentence a drug convict, because of the ironclad sentencing laws, to a term that was ‘too severe,’” and two-thirds said it happened frequently. Eighty-three percent said they had never sentenced a drug kingpin for zone violation, and 94% said they usually sentenced addicts, small-time dealers and couriers. “I know what the Legislature had in mind when it did this,” said Judge Cortland A. Mathers. “But it hasn’t worked. Not at all.”[28]
The Boston Globe survey was taken 12 years ago, but one critical fact suggests that judges still believe that the law unfairly requires them to apply harsh sentences to relatively minor offenses. In more than half of the 349 enhancement zone convictions in 2004, Sentencing Commission data shows that the judge sentenced the defendant to one day of jail time for the underlying offense.[29] Only two possible conclusions can be drawn from this fact: either the facts of the case reflect an insignificant offense and the judge gave the shortest sentence possible under the law, or the judge recognized that the two-year mandatory minimum was excessive and reduced the penalty for the underlying offense in an attempt to compensate for the injustice. Either way, many judges are aware that most of the population being sentenced under the legislation is not pushing drugs on children, as the legislature envisioned.
William Brownsberger’s work, as previously mentioned, demonstrated that children are rarely present for drug transactions charged as zone offenses; our demonstration of the zones’ true size asserts that 1,000 feet is too large to assume that two people within that distance can affect each other directly. The legislature was simply wrong to assume that all transactions within 1,000 feet of a school are transactions in which children are endangered.
Furthermore, since 1982, Massachusetts has had specific penalties for selling drugs to children,[30] and in 1990, the legislature created a specific penalty for using children in the drug trade.[31]
Recommendations
A law aimed at reducing children’s exposure to drugs should punish those specific crimes, not generalize about the nature of the activity within a huge area. Though the sentencing enhancement zone statute was written for an important purpose, its fundamental flaws ensure its complete ineffectiveness as a deterrent. In addition, it does insidious and devastating harm to urban, minority, and poor populations.
As Vermont’s example has shown, however, the legislation may be rewritten to improve public safety and eliminate the present inherent injustices. (See sidebar: Vermont’s unique sentencing enhancement zone statute emphasizes that the zone laws should be highly specific and only one of many responses to drugs.) Reform would allow the state to spend its limited criminal justice resources on effective policies, instead of squandering them on small-time addicts who do not endanger children.
In writing this report, we set out to discover whether the sentencing enhancement zone law punished certain populations more harshly because of where they live, and whether 1,000 feet was a logical or effective distance for a geography-based sentencing enhancement. We found that, despite the legislature’s good intentions, the first supposition was true and the second was not, resulting in a statute that is both harmful and ineffective. Here we identify three possible courses of action, all of which would improve children’s safety and reduce the law’s negative effects. The law may be amended to apply only to adults dealing drugs to children, it may be repealed entirely, or it may be modified so that the zones are shrunk to more reasonable sizes.
1. Amend the law to exempt people and behaviors outside the law’s purpose of protecting children from drug-dealing adults.
Simple changes could eliminate many of the current law’s inefficiencies and injustices:
- Exempt incidents where children are not present.
- Exempt children from being charged as enhancement zone violators themselves.
- Exempt incidents where two people are privately sharing drugs and money does not change hands.
- Apply zone charges only to distribution, not the ambiguous “possession with intent,” so that drug addicts are not charged as drug dealers.
- Exclude drug sales that take place in private residences, out of view of the public.
- Give judges the discretion to determine the sentence for a school zone offense and whether such a sentence may be served concurrently. Judges are uniquely qualified to review the facts of specific cases and determine the appropriate sentences. Rather than enumerate a long list of exceptions to the mandatory minimum, the legislature should allow judges to determine a sentence that coincides with the law’s intent.
These amendments — which already exist in many states[32] — would eliminate many situations where a long zone sentence would not enhance children’s safety, yet a judge must order it. However, these amendments would not cure the serious geographic flaws identified in this report.
2. Repeal the sentencing zone statute and enforce the existing laws which are narrowly tailored to deter the specific behavior of selling drugs to or in the presence of children. Depending on the drug involved, Chapter 94C, S32F provides for mandatory minimum sentences of at least two to five years for drugs sold to a person under the age of 18. Section 32K provides for a mandatory sentence of five years for “inducing or abetting minor to distribute or sell controlled substances.”
3. Modify the sentencing zone law so that it could work.
We argued above that the 1,000-foot distance was a fundamental flaw in the statute that prevented it from working effectively. In order for the law to function as a geographic deterrent, offenders must be able to identify the borders of the zones and be able to leave them without unintentionally stepping into others. The best way to ensure this is to limit the number of places that qualify for zone protection, limit the size of the zones themselves, and mark the borders clearly.
If the legislature retains the enhancement zones, we recommend reducing the zones’ size to 100 feet around schools and parks, so that they may effectively steer drug activity away from children. Unlike the current 1,000-foot distance, 100 feet is relatively easy to identify. Posting signs at the corners of the zone properties, explaining the zones and the penalty for violation, would be clear enough to work as a geographic deterrent.
Reducing the size of the school zones would also reduce the statute’s disparity in sentencing. We calculated the zones that would exist if the law specified a 100-foot distance and did not apply to Head Start facilities added in the 1998 amendments. As the map below reflects, sizable areas in Hampden County would still be eligible for the zone enhancement, but our research suggests that the racial disparity in sentencing would drop. Under such a statute, 6% of the county would be living in a zone. That population would be 6% White, 8% Black, and 9% Latino, a significantly smaller disparity. (See Table 3.)
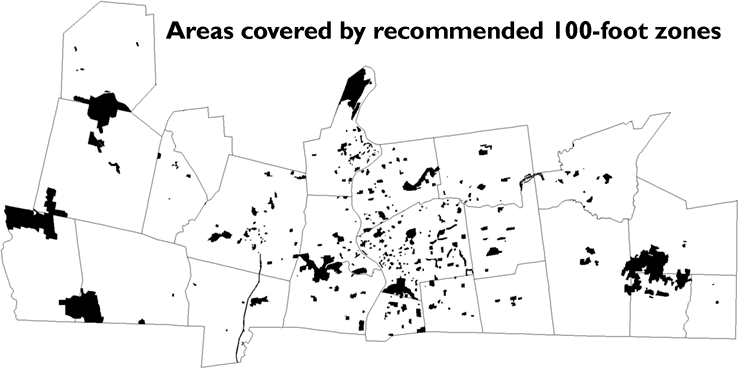
Figure 7. Shrinking the zones to 100 feet will make them more effective at moving drug dealing away from children and less harmful to Black and Latino communities.
| Current statute | Recommended statute | |
|---|---|---|
| Percent of county living in sentencing enhancement zones | 36% | 6% |
| White people living in sentencing enhancement zones | 29% | 6% |
| Black people living in sentencing enhancement zones | 52% | 8% |
| Latino people living in sentencing enhancement zones | 59% | 9% |
Methodology
Collection of spatial data
Massachusetts General Laws Chapter 94C, Section 32J declares an enhanced sentence for certain drug offenses that take place within 1,000 feet of the “real property comprising a public or private accredited preschool, accredited headstart facility, elementary, vocational, or secondary school” and within 100 feet of a “public park or playground.” In order to analyze the populations affected by the statute, we had to identify the properties that fit the above criteria in the summer of 2006 and find their property lines. We then drew the lines of 100 or 1,000 feet around each location and used 2000 Census data, the most recent available, to determine the population inside and outside the zones.
The electronic publications of the Office of Geographic and Environmental Information (MassGIS), Commonwealth of Massachusetts Executive Office of Environmental Affairs provided an important starting point for much of our work. MassGIS publishes a point file for all of the schools in the state. At the time of our research, the schools layer was as of 2004, so we used information from each town’s website to remove closed schools and add new schools so that our database would reflect the schools in existence in the summer of 2006.
Parks were identified by a combination of the MassGIS Protected and Recreational Open Space layer, an Arrow Street Western Massachusetts Atlas and Google Maps. Each potential facility was examined for ownership and intended use before a decision was made to include that park in our analysis. As a starting point for identifying the location of parks, we used “Protected and Recreational Open Space” layer files from MassGIS.[33] We used color orthophotography images from MassGIS[34] to check the reported open spaces. We also used a variety of town websites, atlases and online maps (such as Google Maps and Mapquest) when the MassGIS files did not provide the necessary information for our purposes.
We created a map of Head Start facilities from a list of street addresses published by the U.S. Department of Health and Human Services[35]. The statute does not specify who must accredit day care centers, so we mapped only group and school age child care centers accredited by the largest private accreditation organization, the National Association for the Education of Young Children. However, if other accreditation organizations are active in Massachusetts besides NAEYC, we would not have known to include them in our research. While the legislature likely meant for the law to apply to the larger universe of state “licensed” facilities, we decided to use only facilities that met the legislature's stricter definition. We initially mapped all licensed facilities in the state, and found that, consistent with the “urban effect” discussed in this report, the inclusion of these facilities would have magnified our findings of racial disproportionality. While we thought it reasonable to include these facilities, given the ambiguities in the statute we decided to err towards under inclusion.
We used a variety of sources to develop polygon shapefiles of each protected place. The property lines of many schools were reflected in the MassGIS Protected and Recreational Open Space Layer. The cities of Holyoke and West Springfield generously shared a polygon file of each parcel of property in the city. The cities of Springfield and Westfield make property line data available in online GIS systems, and we were able to recreate the property lines shown in our Arcview 9.1 system. Where parcel ownership data was available, we were able to confirm whether adjoining parcels were owned by the school and were able to include them in our analysis as being subject to the Massachusetts school zone statute. As a last resort, we used the high-resolution aerial photography published by MassGIS to develop our property line database.
Census data, our terminology on urban, rural, race and ethnicity, and corrections made to U.S. Census data
Several methodological quirks in how the U.S. Census counts the population complicated our analysis of how enhancement zones disproportionately impact minority communities.
First, the Census Bureau considers Hispanic/Latino to be an ethnicity and not a race, so Latinos are also counted as Black, White, or any other race. Second, the Census Bureau has recently allowed people to identify as more than one race. Because we did not want to overestimate the impact of the zone laws (for example, counting a Black Latino as two separate people) we used the following terms and data sources, inspired by the U.S. Office of Management and Budget’s Directive 15, which offered guidance on how to aggregate race and ethnicity data for civil-rights enforcement purposes.
Where this report uses the term “White,” we used Census Bureau data for “Not-Hispanic Whites Alone,” published in Summary File 1, Table P4. Where this report uses the term Black, we used the Census Bureau data for “Not Hispanic: Black or African American alone or in combination with one or more other races,” published in Summary File 1, Table P10. Our data for Latinos comes from Table P4 and total population from Table P1, which are both in Summary File 1.
The Census Bureau classifies each person as living in an urban or rural area in Summary File 1, Table P2. Urban areas are “densely populated” areas with at least 2,500 people. As shown in Appendix D, 9 cities or towns were at least 90% urban, and 9 cities or towns were at least 90% rural. We used this Census method of classification, rather than the number of people who live per square mile, because the latter method skews the results of both rural and urban places with large uninhabitable areas, such as military runways and parks.
Our educational attainment data was drawn from the U.S. Census Summary File 3, Table P37 and reflects adults 25 years and older. So that people who stopped their education prior to high school were properly included as lacking a high school diploma or GED, we aggregated all educational levels below a high school diploma/GED and all genders. Our poverty data is based on income in 1999 and published by the U.S. Census in Summary File 3, Table P87.
Despite the Massachusetts definition of “inhabitant” prohibiting such a designation, the Census Bureau counts incarcerated people as if they were legal residents of the place where they are incarcerated. People in prison are not part of the communities where they are incarcerated, and given the disproportionate incarceration of Blacks and Latinos in Massachusetts, the enumeration of prisoners in the House of Corrections has the potential to skew this study. We therefore removed the correctional populations from the underlying Census data.
The Census Bureau publishes counts of Correctional Facilities in Summary File 1, table P37, down to the block level, and the race and ethnicity of the group quarters population (including correctional facilities) in Summary File 1, tables PCT17A through PCT17I, down to the tract level. With these tables, we were able to determine race and ethnicity of the incarcerated population and subtract them from individual blocks. The population we removed from the Census data is below:
| Town | Tract | Block | P001001 Total population: Total | P004003 Total population: Not Hispanic or Latino | P004005 Total population: Not Hispanic or Latino; Population of one race; White alone | P010004 Total races tallied: Not Hispanic or Latino; Black or African American alone or in combination with one or more other races | |
|---|---|---|---|---|---|---|---|
| Western Mass. Correctional Alcohol Center | Springfield | 801102 | 2005 | 228 | 188 | 162 | 26 |
| House of Corrections | Ludlow | 810414 | 9008 | 1,464 | 513 | 171 | 337 |
| House of Corrections | Ludlow | 810414 | 9013 | 196 | 77 | 48 | 29 |
We did not adjust the poverty data, because the U.S. Census Bureau’s poverty calculations are based on households from which people in prison are already excluded. The educational attainment data was not adjusted, because we were unable to identify a methodology that would subtract only the prison population and none of the surrounding resident population from the Ludlow totals. The urban/rural data was not adjusted, because doing so would not have affected our results.
Data display and calculation
To illustrate how Massachusetts’ enhancement zone law affects minority populations, we used the “display by dot density” feature of ArcView 9.1 to estimate the distribution of the population in each Census block. The Census Bureau collects actual addresses, but, for confidentiality reasons, only publishes the data aggregated to units of geography called “blocks” and “blockgroups.” In urban areas, a “block” tends to be a city block, but in more rural areas, the blocks can be much larger. As it is impossible to determine exactly where in a Census block someone lives, we used a dot-density map to display the concentrations of different populations. We aggregated our data for Blacks and Latinos and illustrated each Black or Latino person as one very small red dot. Each White person is illustrated as a very small blue dot. We made the borders of each block invisible and told the software to randomly distribute the requisite number of dots in each block. The enhancement zones display was created with a multiple-step process. Once we had built a polygon shapefile with each type of protected place, we used the Arcview 9.1. buffer tool to create new polygons of 100-foot buffers around parks and 1,000-foot buffers around other statutory places. We used the dissolve command to create one polygon shapefile of the combined zones and then clipped the shapefile to the county’s borders.
Because many Census Blocks were not entirely inside or outside a zone, our zone impacts were calculated using a similar approximation method. We calculated the area in square meters of each Census block, and then used the “union” feature in Arcview 9.1 to split each Census block into “zone” and “not zone” portions. We then calculated the area in square meters of each new polygon. We removed the Census Block portions that were outside the zones and divided the size of the new polygons with the initial area measurement. As a result, each piece of a Census Block was given a numeric percentage reflecting how much of the Census Block piece was of the original block. By multiplying this percentage by Census data for that block, we could develop estimates of the population within the zones.
Similar methods were used to calculate the population that would be inside enhancement zones if the zones were redrawn as 100-foot distances around only schools and parks. Poverty and educational data is only available at the larger blockgroup level, so this methodology was applied a third time over a polygon shapefile of blockgroups published by the U.S. Census Bureau.
Acknowledgments
This report was produced with the support of a generous research and advocacy grant from the Poverty and Race Research Action Council in Washington D.C. Aleks Kajstura’s work on the project was supported by the Cardozo Public Interest Summer Stipend Program at the Benjamin N. Cardozo School of Law and William Goldberg’s work was supported by the Smith College PRAXIS program.
We are indebted to the researchers who have gone before us and who generously shared their time and experience with us: William Brownsberger, Judy Greene, Kevin Pranis and Jason Ziedenberg. We are grateful for the help of consultant Dennis McGinnis, who designed our photo illustrations of the 1,000-foot distance. The task of mapping schools in this project was greatly reduced thanks to the generosity of the City of Holyoke Planning Department and the West Springfield GIS department, who shared their property databases with us. Attorneys Deborah Roberge, Rebecca Young and Michael Fellows offered us extremely helpful advice and inspiration. Theresa Perrone helped us develop the necessary GIS methodology for the project and David Pepyne and Thomas Teich helped to plan our images. Prison Policy Initiative law clerks Brett Blank and John Hejduk helped with last-minute report preparations, and Laura Sager, Monica Pratt Raffanel and Jason Ziedenberg helped with disseminating the report. We thank the Massachusetts Sentencing Commission for its help identifying available data and Vermont Representative Maxine Grad for explaining the history of the Vermont statute. The support of these individuals and organizations was invaluable. Any errors that remain are solely those of the authors.
About the authors
Aleks Kajstura will graduate from the Benjamin N. Cardozo School of Law in May 2008.
Peter Wagner is an attorney and Executive Director of the Prison Policy Initiative. Since 2002, he has been working to quantify the impact of, publicize, and reform the Census Bureau’s practice of counting the nation’s predominantly urban prisoners as if they were residents of the nation’s mostly rural prison towns. His publications include Importing Constituents: Prisoners and Political Clout in New York (2002), Jim Crow in Massachusetts? Prisoner Disenfranchisement (2004) and, with Eric Lotke, Prisoners of the Census: Electoral and Financial Consequences of Counting Prisoners Where They Go, Not Where They Come From (2004).
William Goldberg is a student at Smith College.
About the Prison Policy Initiative
The Easthampton, Massachusetts-based non-profit, non-partisan Prison Policy Initiative documents the impact of mass incarceration on individuals, communities, and the national welfare. We produce accessible and innovative research to empower the public to participate in creating better criminal justice policy.
Foonotes
[1] A 1993 amendment added a 100-foot zone around parks and playgrounds, and a 1998 amendment added accredited daycare and Head Start facilities to the list of schools with a 1,000-foot zone.
[2] Massachusetts Department of Health, COMMONWEALTH OF MASSACHUSETTS SUBSTANCE ABUSE STRATEGIC PLAN 25, May 16, 2005 available at http://www.tbf.org/uploadedFiles/CJI_11.2.05.pdf.
[3] According to the Massachusetts Sentencing Commission, in fiscal year 2004, 281 people were sentenced to two-year mandatory minimum sentences in Houses of Correction and 66 people were sentenced to two-and-a-half year prison sentences. Multiplying the number of people sentenced by the sentence lengths allows us to estimate the number of people incarcerated in any given year for zone offenses. The Massachusetts Department of Corrections estimates that it costs $43,025.63 to incarcerate one person for a year.
[4] Kristen Lombardi, Cheap Trick: Cash-strapped state legislators are finally considering relaxing mandatory drug sentences, BOSTON PHOENIX, January 26, 2007.
[5] U.S. Census 2000, Summary Files 1 and 3. See Appendix A.
[6] Massachusetts Court System, Fiscal Year 2005 Statistics, Criminal Cases - By Court, available at http://www.mass.gov/courts/courtsandjudges/courts/districtcourt/crimstats2005_page3.html and U.S. Census 2000. See Appendix B.
[7] JUDITH GREENE, KEVIN PRANIS, AND JASON ZIEDENBERG, DISPARITY BY DESIGN: HOW DRUG-FREE ZONE LAWS IMPACT RACIAL DISPARITY - AND FAIL TO PROTECT YOUTH 3 (Justice Policy Institute) 2006, available at http://www.justicepolicy.org/reports/SchoolZonesReport306.pdf.
[8] Peter J. Howe, School drug-free plan touted: Mass. local leaders asked to back bill, THE BOSTON GLOBE, Jan. 8 1989, at 34.
[9] E.g., Commonwealth v. Alvarez, 413 Mass 224, 229-230 (1992).
[10] REPORT ON NEW JERSEY’S DRUG FREE ZONE CRIMES & PROPOSAL FOR REFORM 14 (The New Jersey Commission to Review Criminal Sentencing) 2005, available at http://sentencing.nj.gov/dfz_report_pdf.html.
[11] Peter B. Sleeper, Bill would try to curb schoolyard drug sales; Dukakis wants tough penalties for offenders, THE BOSTON GLOBE, Jan. 7 1989, at 30.
[12] Some Massachusetts schools currently post “drug-free zone” signs on their buildings, but there is no note of where school property ends, or indication that the sign alludes to an increased penalty for drug offenses and is not simply a standard to which the school aspires. For example, teachers sometimes post “Hate-Free Zone” stickers to signify that remarks against GLBT people are unwelcome in their classrooms. Though the two use the same terminology, there is no way to determine which violation may result in detention and which may result in the punitive power of the state.
[13] DEPARTMENT OF HEALTH AND HUMAN SERVICES, RESULTS FROM THE 2004 NATIONAL SURVEY ON DRUG USE AND HEALTH: NATIONAL FINDINGS 1 (Substance Abuse and Mental Health Services Administration (SAMHSA)) 2005.
[14] MARIJUANA MYTHS & FACTS: THE TRUTH BEHIND 10 POPULAR MISPERCEPTIONS 17 (Office of National Drug Control Policy), available at http://whitehousedrugpolicy.gov/publications/marijuana%5Fmyths%5Ffacts/marijuana_myths_facts.pdf.
[15] WILLIAM N. BROWNSBERGER & SUSAN AROMAA, AN EMPIRICAL STUDY OF THE SCHOOL ZONE LAW IN THREE CITIES IN MASSACHUSETTS 22 (Join Together and Boston University School of Public Health) 2001, available at http://www.jointogether.org/resources/pdf/school_zone.pdf.
[16] Anand Vaishnav, Drug-Free Zones Questioned, Study Says Law Failed to Stop Sale Near Schools, THE BOSTON GLOBE, July 19, 2001, at B4.
[17] REPORT ON NEW JERSEY’S DRUG FREE ZONE CRIMES & PROPOSAL FOR REFORM 26 (The New Jersey Commission to Review Criminal Sentencing) 2005, available at http://sentencing.nj.gov/dfz_report_pdf.html.
[18] WILLIAM N. BROWNSBERGER & SUSAN AROMAA, AN EMPIRICAL STUDY OF THE SCHOOL ZONE LAW IN THREE CITIES IN MASSACHUSETTS 20 (Join Together and Boston University School of Public Health) 2001, available at http://www.jointogether.org/resources/pdf/school_zone.pdf.
[19] REPORT ON NEW JERSEY’S DRUG FREE ZONE CRIMES & PROPOSAL FOR REFORM 26 (The New Jersey Commission to Review Criminal Sentencing) 2005.
[20] Brownsberger suggests a distance of 100-200 feet and the New Jersey Commission to Review Sentencing recommends 200 feet. WILLIAM N. BROWNSBERGER & SUSAN AROMAA, AN EMPIRICAL STUDY OF THE SCHOOL ZONE LAW IN THREE CITIES IN MASSACHUSETTS 22 (Join Together and Boston University School of Public Health) 2001, available at http://www.jointogether.org/resources/pdf/school_zone.pdf and REPORT ON NEW JERSEY’S DRUG FREE ZONE CRIMES & PROPOSAL FOR REFORM 29 (The New Jersey Commission to Review Criminal Sentencing) 2006, available at http://sentencing.nj.gov/dfz_report_pdf.html.
[21] JUDITH GREENE, KEVIN PRANIS, AND JASON ZIEDENBERG, DISPARITY BY DESIGN: HOW DRUG-FREE ZONE LAWS IMPACT RACIAL DISPARITY - AND FAIL TO PROTECT YOUTH 16 (Justice Policy Institute) 2006, available at http://www.justicepolicy.org/reports/SchoolZonesReport306.pdf.
[22] WILLIAM N. BROWNSBERGER & SUSAN AROMAA, AN EMPIRICAL STUDY OF THE SCHOOL ZONE LAW IN THREE CITIES IN MASSACHUSETTS 14 ( Join Together and Boston University School of Public Health) 2001, available at http://www.jointogether.org/resources/pdf/school_zone.pdf.
[23] WILLIAM N. BROWNSBERGER & SUSAN AROMAA, AN EMPIRICAL STUDY OF THE SCHOOL ZONE LAW IN THREE CITIES IN MASSACHUSETTS 19-20 (Join Together and Boston University School of Public Health) 2001, available at http://www.jointogether.org/resources/pdf/school_zone.pdf.
[24] The U.S. Census identified the populations of Agawam, Chicopee, East Longmeadow, Holyoke, Longmeadow, Ludlow, Springfield, West Springfield, and Westfield has being 90-100% urban. See Methodology.
[25] The U.S. Census identified the populations of Blandford, Brimfield, Chester, Granville, Holland, Montgomery, Russell, Tolland, and Wales as 90-100% rural. See methodology.
[26] THE NHSDA REPORT: ILLICIT DRUG USE IN METROPOLITAN AND NON-METROPOLITAN AREAS table 2 (Substance Abuse and Mental Health Services Administration) 2002 , available at http://oas.samhsa.gov/2k2/Urban/Urban.htm.
[27] State populations are from U.S. Census 2000, Summary File 1, Tables P4 and P10. County jail populations are from NEW COURT COMMITMENTS TO MASSACHUSETTS COUNTY CORRECTIONAL FACILITIES DURING 2005 ii (Massachusetts Department of Corrections) 2006, available at http://www.mass.gov/Eeops/docs/doc/research_reports/2005cty.pdf. State prison populations are from JANUARY 1, 2006 INMATE STATISTICS Table 27 (Massachusetts Department of Corrections) 2006, available at http://www.mass.gov/Eeops/docs/doc/research_reports/112006.pdf. Sentencing enhancement zone conviction data from SURVEY OF SENTENCING PRACTICES, FY2004 Table 38 (Massachusetts Sentencing Commission) 2005, available at http://www.mass.gov/courts/admin/sentcomm/fy2004survey.pdf.
[28] Dick Lehr, A Judgment on Sentences, THE BOSTON GLOBE, Sept. 27, 1995, at 24.
[29] SURVEY OF SENTENCING PRACTICES, FY 2004 table 38 (Massachusetts Sentencing Commission) 2005, available at http://www.mass.gov/courts/admin/sentcomm/fy2004survey.pdf.
[30] Mass Gen. Laws ch. 94C S32F.
[31] Mass Gen. Laws ch. 94C S32K.
[32] E.g. 16 Del. C. S4767(a)(2)(d) (an affirmative defense where the activity was on private property, not done for profit, and no minors were present), Conn. Gen. Stat. S21a-279(d) (excludes any person enrolled in the school or daycare), N.C. Gen Stat. S90-95(e)(5), (8), (10) (applies a lower class of felony depending on the ages of the people involved, and excludes sharing small amounts of marijuana), 18 V.S.A. S4237(a), (b), (c)(3) (penalty is age-dependant, and exempts sharing drugs on adjoining property out of public view).
[33] Available at http://www.mass.gov/mgis/osp.htm.
[34] Available at http://www.mass.gov/mgis/colororthos2001.htm.
[35] Available at http://eclkc.ohs.acf.hhs.gov/hslc/HeadStartOffices.


