Where people in prison come from:
The geography of mass incarceration in Louisiana
by Voice of the Experienced, the Redistricting Data Hub (Spencer Nelson and Peter Horton), and the Prison Policy Initiative
July 2023
Press release
One of the most important criminal legal system disparities in Louisiana has long been difficult to decipher: Which communities throughout the state do incarcerated people come from? Anyone who lives in or works within heavily policed and incarcerated communities intuitively knows that certain neighborhoods disproportionately experience incarceration. But data have never been available to quantify how many people from each Louisiana community are imprisoned with any real precision.1
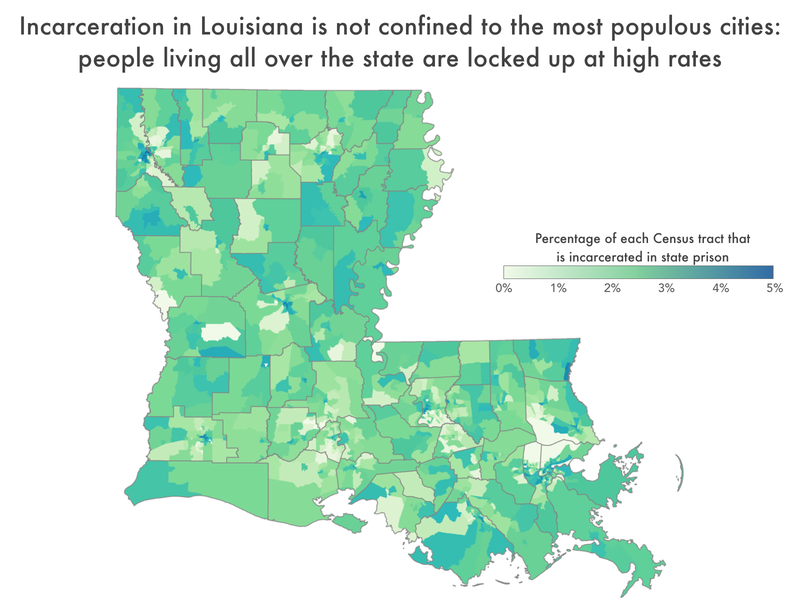
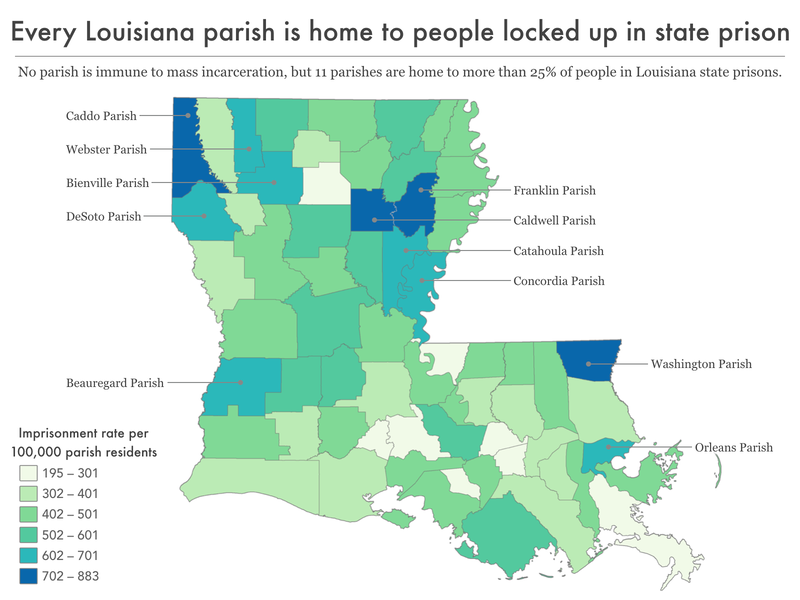
Using 2022 data that Voice of the Experienced (VOTE) obtained from the Louisiana Department of Public Safety & Corrections, we found that in Louisiana, incarcerated people come from all over the state, and unsurprisingly, the largest number of imprisoned people are from the state’s most populous cities of New Orleans, Shreveport, and Baton Rouge. However, a handful of less populous and more rural communities — like the parishes of Washington, Franklin, Caldwell, and Webster — have some of the state’s highest imprisonment rates per 100,000 residents,2 suggesting that people all over Louisiana are affected by the state’s reliance on mass incarceration.
In addition to helping policy makers and advocates effectively bring reentry and diversion resources to these communities, this data has far-reaching implications. Around the country, high imprisonment rates are correlated with other community problems related to poverty, employment, education, and health. Researchers, scholars, advocates, and politicians can use the data in this report to advocate for bringing more resources to their communities.
Incarcerated people come from all over Louisiana — but disproportionately from some places more than others
Our analysis of the Louisiana Department of Public Safety & Corrections data shows that incarcerated people come from every portion of the state and that some communities bear the heaviest burden from mass incarceration. This report’s analysis of the distribution of pre-incarceration homes is based on our reallocation of more than three quarters of the in-custody population to addresses outside of correctional facilities.5
In order to make apples-to-apples comparisons of the prevalence of incarceration between parishes, cities and other communities of different sizes, this report uses imprisonment rates expressed as a number of people in prison per 100,000 residents. For the purposes of this analysis — looking only at the numbers of people who were successfully reallocated to specific non-prison addresses in the state — Louisiana has an imprisonment rate of 451 per 100,000 residents.6
Parish trends
Most broadly, we find that incarcerated people in Louisiana come from every corner of the state: every single one of the state’s 64 parishes is missing a portion of its population to incarceration.7
Orleans Parish — which is made up entirely of the state’s largest city of New Orleans — has the most residents imprisoned (2,519) of all Louisiana parishes, with a citywide imprisonment rate of 652 per 100,000 residents. The parish with the second most imprisoned people is nearby Jefferson Parish, with 2,070 people imprisoned at a rate of 468 per 100,000 residents (Jefferson Parish is also the second most populous parish in the state, second to East Baton Rouge). But even with over 2,000 parish residents in state prison, there are twenty eight Louisiana parishes with higher imprisonment rates than Jefferson Parish. The southeastern Washington Parish has the highest imprisonment rate in the state (901 per 100,000) and has 402 residents in the custody of the Louisiana Department of Public Safety & Correction. Although Washington Parish is missing fewer people to prison than East Baton Rouge Parish, the parish — along with a handful of other midsize and smaller parishes like Franklin, Caldwell, Webster, and Catahoula, in addition the much more populous parishes of Caddo and Orleans — is missing a relatively large proportion of their population Louisiana Department of Public Safety & Corrections’ custody. The high imprisonment rates in these less populous parishes means that the idea that incarceration is a problem uniquely experienced in cities is a myth.
City trends
Across the state, the largest cities are incarcerating the most people: New Orleans has 2,519 residents in Louisiana Department of Public Safety & Corrections’ custody (652 per 100,000 residents), Shreveport has 1,557 (824 per 100,000 residents), and Baton Rouge has 1,271 (556 per 100,000 residents). The residents of these three cities are predominantly Black, and we know that across the country, the criminal legal system disproportionately and unfairly targets the communities of color, particularly Black communities. This appears to be true in these three cities as well. In New Orleans, which is 58% Black, Black people make up 74% of arrests by New Orleans police and in Shreveport (57% Black), Black people account for 75% of arrests by Shreveport police. Even more dramatically, in Baton Rouge (53% Black), Black people account for almost 85% of arrests by the Baton Rouge Police Department. The racial disparities we see in arrests in the largest Louisiana cities carry through to the prison population’s demographic makeup: the prison population is 65% Black, compared to the statewide population that is 33% Black.
Not all imprisonment is concentrated in the state’s largest cities, however. A handful of smaller cities — Bogalusa, Ville Platte, Bastrop, and Marksville — have imprisonment rates higher than New Orleans, Shreveport, and Baton Rouge. The city of Bogalusa, in particular, stands out with the highest imprisonment rate of all Louisiana cities. While the total population is just under 11,000 people, the imprisonment rate is staggeringly high: with a total of 180 Bogalusa residents in prison, the imprisonment rate is 1,661 per 100,000 city residents. Bogalusa is one of the poorest cities in Louisiana, with more than 32% of the city’s residents living in poverty, compared to the statewide poverty rate of 20% (and compared to New Orleans, Shreveport, and Baton Rouge, which have a poverty rate of 23-25%). This fits with nationwide trends: incarcerated people tend to have been among the poorest people in the country before their incarceration.
In addition, imprisonment plays a significant role outside of Louisiana’s metropolitan areas. Among Louisiana residents living outside of cities, towns, and villages, the imprisonment rate is 343 per 100,000 residents, higher than the imprisonment rates in cities like Lafayette, Central, and Zachary. Across the state, Louisianans are facing high rates of incarceration, regardless of if they live in an urban or rural part of the state.
Neighborhood trends
New Orleans
Among localities with populations of at least 200,000, New Orleans is one of the most racially segregated cities in the country, and has actually seen increasing segregation in the 21st century, while many other large cities have seen decreasing segregation in recent decades. Researchers at the University of California, Berkeley explain just how post-Civil War federal, state, and local policies shaped much of today’s New Orleans neighborhoods via “exclusionary zoning, redlining, neighborhood covenants and Jim Crow laws [that] worked to separate Black residents from white residents and from their rights.” Research shows that these racist housing policies8 pushed Black New Orleans residents to lower elevation neighborhoods, leaving them more vulnerable to displacement in 2005 when Hurricane Katrina struck the city. A poignant statistic from the Other & Belonging Institute at the University of California, Berkeley, highlights just how disproportionate the effects of the hurricane were on Black New Orleans residents: “When Hurricane Katrina hit in 2005 residents of all racial, ethnic, and class groups were displaced by the storm and resultant flooding; but 70 percent of long-term white residents were able to return within one year of the storm, while only 42 percent of Black residents were able to return in that same time.” Post-Katrina policies further cemented the city’s housing segregation and continued to push Black residents out of historically Black neighborhoods: the starkest examples of this include the demolition of the St. Thomas housing projects and the razing of hundreds of homes in the majority Black Mid-City area in order to construct new hospitals.9
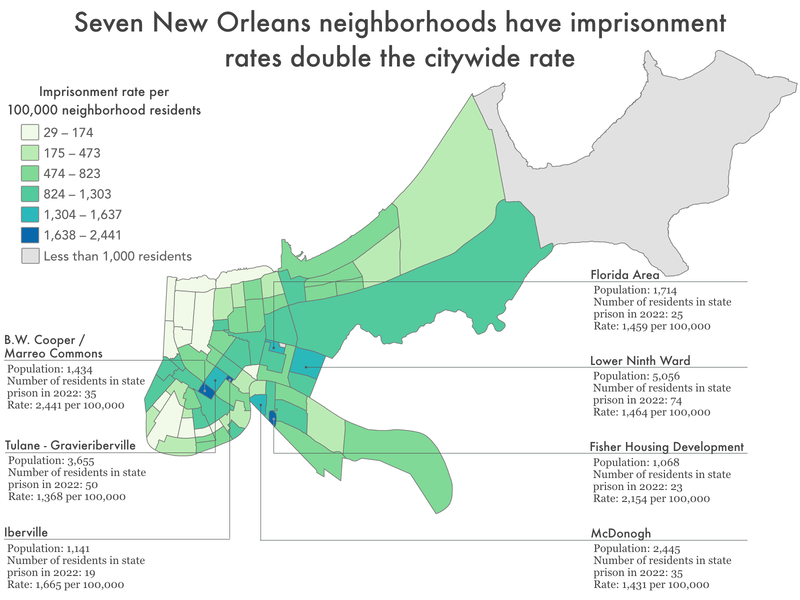
The city of New Orleans has an imprisonment rate of 652 per 100,000 residents, but 19 of the city’s 72 neighborhoods have imprisonment rates above 1,000 per 100,000, meaning that these 19 neighborhoods are each missing more than 1% of their residents to state prison.10 It is not a coincidence that many of these neighborhoods are predominately Black, have some of the lowest median incomes in the city, and are at the lowest elevations in the city (and therefore at the highest risk for displacement following another hurricane, a consequence of environmental racism). Across the country, we know that structural racism and poverty play a significant role in the disproportionate impact of criminal legal system involvement on people of color and poor people, and it is no different in New Orleans.
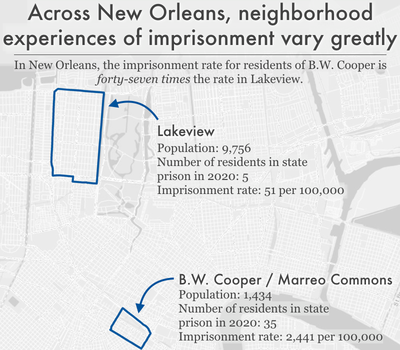
In early 20th century New Orleans, property deed restrictions could prohibit an owner from selling or renting to Black residents. According to the Louisiana Fair Housing Action Center, a 1913 deed restriction in the northwestern neighborhood of Lakeview required all home purchasers to agree to not sell or rent to Black families. In 1979, after these restrictions were ruled unconstitutional, the sale of the same property noted that the new owners were subject to the same restrictions on selling or renting to Black residents as noted in the 1913 restriction. Policies like this carry long term effects: to this day, Lakeview’s residents are 84% white, compared to the New Orleans citywide population that is only 33% white and the statewide population that is 62% white. The Lakeview neighborhood also has one of the lowest imprisonment rates in the city at 51 per 100,000, with only five of the almost 9,800 residents imprisoned; this neighborhood imprisonment rate is 12 times lower than the citywide imprisonment rate. Similarly, in the Garden District, further southeast, neighborhood residents are 92% white, with a relatively low imprisonment rate of 106 per 100,000, with only 2 residents in state prison. In contrast, the similarly sized B.W. Cooper Housing Development neighborhood (also called Marreo Commons)11 is more than 96% Black, and faces an disparately high imprisonment rate of 2,441 per 100,000 residents (with 35 residents imprisoned), almost three times the citywide imprisonment rate.
Baton Rouge
Like New Orleans, Baton Rouge is also considered one of the most racially segregated cities in the U.S. and the rates of imprisonment across the city of Baton Rouge and the parish of East Baton Rouge follow this trend as well. The highest rates of imprisonment are concentrated in the neighborhoods that are predominantly the home to people of color and facing higher rates of poverty than the rest of the city. This does not necessarily reflect higher crime rates in these communities, but instead, a divestment of resources for community members and an overinvestment in policing: Baton Rouge’s population is 53% Black, but Black people account for 84% of arrests made by Baton Rouge Police. Similarly, the East Baton Rouge Parish population is 47% Black, but Black people account for 70% of arrests made by the parish’s Sheriff’s Office.
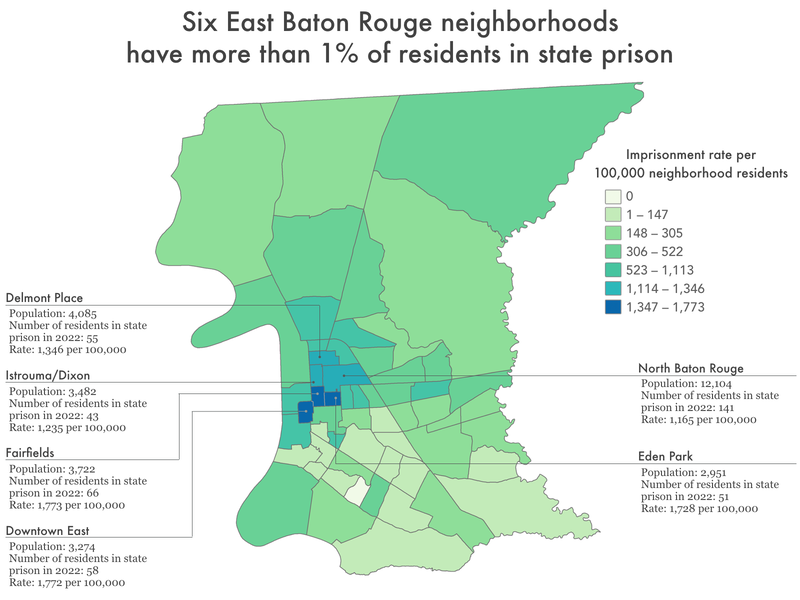
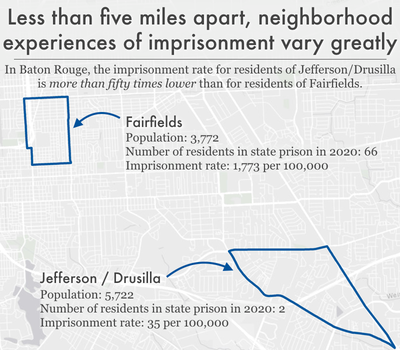
Given the disproportionate policing of Black Baton Rouge residents, it is not surprising that predominantly Black communities in East Baton Rouge Parish have higher imprisonment rates than the rest of the city. For example, the majority (96%) Black neighborhood of Fairfields has the highest imprisonment rate in the parish with almost 2% of the neighborhood locked up: 1,773 per 100,000 residents (this is more than three times the imprisonment rate of the city of Baton Rouge).
In contrast, in the majority (70%) white Jefferson/Drusilla neighborhood to the southeast, the imprisonment rate is more than 49 times lower: 35 people imprisoned per 100,000 neighborhood residents. Similarly, some of the neighborhoods with very low incarceration rates are made up predominantly of college students. The Louisiana State University campus is spread across a few Baton Rouge neighborhoods, including the LSU neighborhood, College Town, and South Campus. Although crime and drug use statistics tend to be irregularly reported amongst college students, studies suggest that rates of drug use and sexual assault are high on college campuses, but imprisonment rates in these areas are still relatively low compared to the surrounding neighborhoods. The LSU neighborhood – which is home to more than 10,500 residents – is mostly home to young adults (presumably college students) with 70% of residents aged 18-24. The imprisonment rate in the LSU neighborhood is one of the lowest in the entire city of Baton Rouge: 19 per 100,000 (in fact, only one parish neighborhood — Kenilworth — has a lower imprisonment rate).12
Undoubtedly, socioeconomic status and poverty also play into neighborhood differences in all levels of involvement in the criminal-legal system. The East Baton Rouge Parish neighborhoods with the highest incarceration rates have higher rates of poverty than the parish and city at large. It is clear that high-incarceration East Baton Rouge Parish neighborhoods — including Fairfields, Downtown East, Eden Park, and Delmont Place (which all have more than 1% of their residents imprisoned) — are also facing much higher rates of poverty and unemployment than other parish communities. More than 30% of families in these four high-imprisonment neighborhoods are living in poverty; and in Fairfields and Downtown East, more than 16% of adults are unemployed. Compared to the entirety of East Baton Rouge Parish, where 12% of families are in poverty and 6% of adults are unemployed, it is clear that residents of these neighborhoods are simultaneously facing a host of other challenges and systemic disadvantages that combine to make almost every aspect of life difficult.
Shreveport
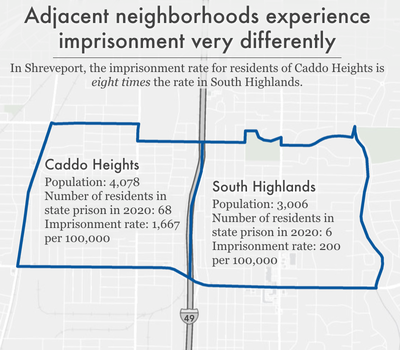
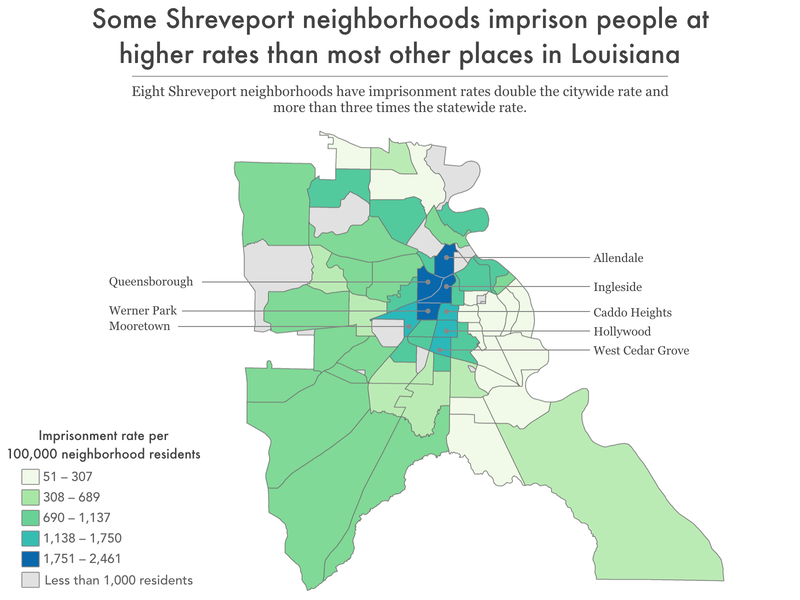
The South Highlands neighborhood — historically considered one of the “best” neighborhoods for real estate investment during redlining — remains predominately white with an imprisonment rate four times lower than the citywide Shreveport imprisonment rate. On the other side of Interstate 49, the neighborhood of Caddo Heights imprisons residents at a rate of 1,667 per 100,000. Caddo Heights was considered one of the most “hazardous” areas during redlining, and remains a predominantly Black neighborhood.
The citywide imprisonment rate of 824 per 100,000 people in Shreveport is higher than the other large cities in the state, and residence data show that some Shreveport communities — particularly predominantly Black communities — are disproportionately affected by mass incarceration. Research has shown that policing tends to target poor communities and neighborhoods composed of people of color, in particular, Black people. This is true in Shreveport, where the city’s population is 56% Black, but Black people make up 75% of the city’s arrests.
Given the disproportionate policing of Black Shreveport residents, it is not surprising that predominantly Black communities in Shreveport have higher imprisonment rates than the rest of the city. For example, the historically Black Shreveport neighborhoods of Allendale, Ingleside, and Queensborough have imprisonment rates over 2,000 per 100,000 residents, more than double than the citywide imprisonment rate.
Historically, Shreveport is one of the starkest examples of redlining in the country. In the 1930s, the federal government rated the “riskiness” of real estate investment in different neighborhoods, resulting in rating non-white neighborhoods as “hazardous” and beginning a cycle of disinvestment in these predominantly Black and immigrant neighborhoods. A 2019 study of formerly redlined neighborhoods in over 100 cities found that these neighborhoods are lower-income and are more likely to be home to Black and Hispanic or Latino residents.
A 2020 report from Measure of America, A Portrait of Louisiana 2020: Human Development in an Age of Uncertainty, provides an analysis of the effects of racist housing policies in Shreveport, highlighting the disparate realities of two adjacent neighborhoods: Caddo Heights and South Highlands. These two neighborhoods are separated by Interstate 49, which divides the city into its eastern and western halves.13 The disparities between these two neighborhoods, as documented in the Measure of America report, are reflected in a number of ways: Caddo Heights’ residents have a life expectancy that is 12.5 years shorter than those in South Highlands, the percent of residents with a bachelor’s degree is 64.5% lower in Caddo Heights, and the median individual income is 3.5 times lower in Caddo Heights. Caddo Heights’ population is 91% Black, while South Highlands is 86% white (compared to the citywide population, which is only 37% white). The vast difference between these two communities, separated only by a highway, is no accident. Rather, it is the long-term consequence of mid-19th century redlining practices. At the time, Caddo Heights was home to a mostly white population, but still considered “hazardous” and “definitely declining,” as these white residents were “low type of wage earners.” Ultimately, areas of the city that were “hazardous” or “declining” were the only options available to Black families in Shreveport, as white people moved out of cities and to the suburbs. At the same time that Caddo Heights was defined as “hazardous,” South Highlands was considered one of the “best” parts of the city with a population that was “100% white” with “no detrimental influence.”
Today, we see the neighborhoods with the highest incarceration rates in Shreveport are also the neighborhoods that were “redlined” in the mid-20th century. Caddo Heights faces one of the highest imprisonment rates in the city: 1,667 per 100,000 residents, which is more than double the imprisonment rate of the city of Shreveport. On the other hand, South Highlands remains a predominantly white neighborhood with an imprisonment rate that is eight times lower than Caddo Heights and four times lower than the citywide imprisonment rate. Decades of systematic oppression and divestment from poorer communities of color — which we know are heavily policed — have left historically redlined communities like Caddo Heights particularly vulnerable to Louisiana’s modern-day reliance on mass incarceration.
While all communities are missing some of their members to prisons, in places where large numbers of adults — parents, workers, voters — are locked up, incarceration has a broader community impact. The large number of adults drained from a relatively small number of geographical areas seriously impacts the health and stability of the families and communities left behind.14
What are the differences between high- and low-incarceration communities?
Across the country, researchers have connected high local incarceration rates with a host of negative outcomes for the people who live there. In the Prison Policy Initiative’s analysis of where incarcerated people in Maryland are from in 2010, we found that Baltimore communities with high rates of incarceration were more likely to have high unemployment rates, long average commute times, low household income, a high percentage of residents with less than a high school diploma or GED, decreased life expectancy, high rates of vacant or abandoned properties, and higher rates of children with elevated blood-lead levels, compared to neighborhoods less impacted by incarceration.
Research has revealed similar correlations15 in communities around the country:
- Life expectancy: A 2021 analysis of New York State census tracts found that tracts with the highest incarceration rates had an average life expectancy more than two years shorter than tracts with the lowest incarceration rates, even when controlling for other population differences.16 And a 2019 analysis of counties across the country revealed that higher levels of incarceration are associated with both higher morbidity (poor or fair health) and mortality (shortened life expectancy).
- Community health: A nationwide study, published in 2019, found that rates of incarceration were associated with a more than 50% increase in drug-related deaths from county to county. And a 2018 study found that Black people living in Atlanta neighborhoods with high incarceration rates are more likely to have poor cardiometabolic health profiles.
An analysis of North Carolina data from 1995 to 2002 revealed that counties with increased incarceration rates had higher rates of both teenage pregnancy and sexually transmitted infections (STIs). A 2015 study of Atlanta also found that census tracts with higher rates of incarceration had higher rates of newly diagnosed STIs.17 - Mental health: A 2015 study found that people living in Detroit neighborhoods with high prison admission rates were more likely to be screened as having a current or lifetime major depressive disorder and generalized anxiety disorder.
- Exposure to environmental dangers: A 2021 study found that people who grew up in U.S. census tracts with higher levels of traffic-related air pollution and housing-derived lead risk were more likely to be incarcerated as adults, even when controlling for other factors.
In New York City, neighborhood incarceration rate is associated with asthma prevalence among adults. Similarly, in our 2020 analysis of New York City neighborhoods, we found higher rates of asthma among children in communities with high incarceration rates.18 - Education: In a 2020 analysis of incarcerated New Yorkers’ neighborhoods of origin from the Prison Policy Initiative, we found a strong correlation between neighborhood imprisonment rates and standardized test scores.19 And a 2017 report on incarceration in Worcester, Mass., found that schools in the city’s high-incarceration neighborhoods tended to be lower-performing. What’s more, students in those neighborhoods faced more disciplinary infractions. In 2017, the ACLU of Washington found that some Washington school districts are more likely to assign police to schools with higher than average populations of students of color and low-income students.
- Community resources and engagement: A 2018 study found that throughout the country, formerly incarcerated people (as well as all people who have been arrested or convicted of a crime) are more likely than their non-justice-involved counterparts to live in a census tract with low access to healthy food retailers. And the 2017 report on Worcester, Mass., revealed that high-incarceration neighborhoods had lower voter turnout in municipal elections.
We already have this wealth of data showing that incarceration rates correlate with a variety of barriers and negative outcomes. The data in this report build on this work by helping identify which specific neighborhoods throughout Louisiana are systematically disadvantaged and left behind. Louisiana residents can use the data in this report to examine granular local-level and state-wide correlations and choose to allocate needed resources to places hardest hit by incarceration.
Implications & uses of these data
These 19 data tables provided here have great potential for community advocacy and future research.
First and most obviously, these data can be used to determine the best locations for community-based programs that help prevent involvement with the criminal legal system, such as offices of neighborhood safety and mental health response teams that work independently from police departments. The data can also help guide reentry services (which are typically provided by nonprofit community organizations) to areas of Louisiana that need them most.
But even beyond the obvious need for reentry services and other programs to prevent criminal legal system involvement, our findings also point to geographic areas that deserve greater investment in programs and services that indirectly prevent criminal legal involvement or mitigate the harm of incarceration. After all, decades of research show that imprisonment leads to cascading collateral consequences, both for individuals and their loved ones. When large numbers of people disappear from a community, their absences are felt in countless ways. They leave behind loved ones, including children, who experience trauma, emotional distress, and financial strain. Simultaneously, the large numbers of people returning to these communities (since the vast majority of incarcerated people do return home) face a host of reentry challenges and collateral consequences of incarceration, including difficulty finding employment, health issues, and a lack of housing. People impacted by the criminal legal system tend to have extremely diminished wealth accumulation. And those returning from prison and jail may carry back to their communities PTSD and other mental health issues from the trauma they’ve experienced and witnessed behind bars. While organizations such as the Formerly Incarcerated Transitions (FIT) Clinic and Formerly Incarcerated Peer Support (FIPS) Group have been formed and VOTE engages in legislative advocacy regarding housing, employment, voting and medical policies — there are still significant gaps in reentry services. Lastly, investing in core community resources to mitigate structural issues like poverty, such as housing and healthcare, will reduce vulnerabilities for criminal legal system contact.
And since we know place of origin correlates with so many other metrics of wellbeing, we can and should target these communities for support and resources beyond what we typically think of as interventions to prevent criminal legal system contact. In communities where the state or city has heavily invested in policing and incarceration (i.e. the high-incarceration neighborhoods we find in our analysis), our findings suggest that those resources would be better put toward reducing poverty and improving local health, education, and employment opportunities.
For example, we know that large numbers of children in high incarceration areas may be growing up with the trauma and lost resources that come along with having an incarcerated parent, and that these children are also more likely to experience incarceration. The information in this report can help with planning and targeting supports, resources, and programming designed to not only respond to the harms caused by incarceration, but disrupt the cycle of familial incarceration.
We invite community leaders, service providers, policymakers, and researchers to use this data to make further connections between mass incarceration and various outcomes, to better understand the impact of incarceration on their communities.
Methodology & data
This report and its first-time-ever state-wide analysis of where incarcerated people in Louisiana call home builds upon an analysis of 21,019 home addresses of people in the custody of the Louisiana Department of Public Safety & Corrections as of 2022. (This represents a sample of approximately 79% of the total incarcerated population, and we discuss the origins and significance of this discrepancy below.)
This section of the report discusses how we processed the data, some important context and limitations on that data, and some additional context about the geographies we chose to include in this report and its appendices. The goal of this report is not to have the final word on the geographic concentration of incarceration, but to empower researchers and advocates — both inside and outside of the field of criminal justice research — to use our dataset for their own purposes. For example, if you are an expert on a particular kind of social disadvantage and have some data organized by county, zip code, school district, or other breakdown and want to add imprisonment data to your dataset, we probably have exactly what you need in a prepared appendix described below.
This report can also be seen as a template for other states because most state departments of corrections already have near-complete home residence records in an electronic format. States should be encouraged to continue improving their data collection, and to share the data (under appropriate privacy protections) so that similar analyses could be performed.
How we processed the data
Voice of the Experience (VOTE) obtained data from the Louisiana Department of Public Safety & Corrections that provides the addresses for the 26,750 people in the custody of the department in 2022.20 Redistricting Data Hub and VOTE then determined which census block each address provided was in, and then aggregated these counts up to the census tracts, neighborhoods and a number of useful state-wide geographies such as parishes, state legislative districts, congressional districts, and even some city-wide geographies such as neighborhoods or city council districts in New Orleans, Baton Rouge, and Shreveport.
Of the original 26,750 records, Redistricting Data Hub and VOTE removed 4,156 records prior to using the Census geocoder. Some records were removed because they contained addresses that were from out of state, incomplete, or obviously not a home address.21 Additional records were excluded because the individual referred to in the record appeared to be detained in a non-physical facility or parole office. Redistricting Data Hub and VOTE located the census block for the addresses in 18,614 of the remaining 22,594 records using the Census geocoding API.
For the remaining valid addresses (3,980) and the valid addresses apart from a known zipcode (416) the Redistricting Data Hub and VOTE used the Google geocoding API as an alternative method to determine the census block of the remaining addresses:
- Of the 416 of these records that were missing a zip code and were therefore not compatible with the Census geocoder tool, Redistricting Data Hub successfully identified the census blocks for 332 of these records using rooftop or range interpolation.
- Of the 3,980 records that were not successfully matched using the Census geocoder, Redistricting Data Hub queried down the latitude and longitude results to just being those of range interpolation or rooftop methods resulting in 2,221 geocoded records. Redistricting Data Hub then performed a spatial join to limit the results to census blocks in Louisiana, and successfully assigned 2,201 records to the appropriate Louisiana census blocks.
As a last step, 128 records were removed because the addresses were geocoded to areas that were clearly not a home address. Therefore, the Redistricting Data Hub was able to successfully assign 21,019 incarcerated people back to a valid last known address.
Finally, we calculated imprisonment rates for each geography, by first calculating a corrected population that shows the non-incarcerated population plus the net change in the number of incarcerated people from that geography; and then dividing the number of incarcerated people by the total population, and then multiplying it by 100,000 to get an imprisonment rate per 100,000.
Important context and limitations on this data
Our analysis in this report documents the home addresses of 21,019 people in the custody of the Louisiana Department of Public Safety & Corrections in 2022. Not included in this analysis are several other groups of Louisiana residents who are incarcerated in other types of facilities:
- Incarcerated in a federal prison; because states do not have the power to require home address data from federal agencies.
- Incarcerated in another state’s prison system; because states cannot require other states to share this information.
- In the custody of a local jail, in this state or elsewhere; because the dataset was limited to people in the custody of the state Department of Public Safety & Corrections.
About the geographies
We’ve organized the data in this report around several popular geographies, as defined by the federal government, by the state, or by individual cities, with the idea that the reader can link the data to the wealth of existing social indicator data already available from other sources.
Unfortunately, the reader may desire data for a specific geography that we have not made available — for example, their own neighborhood, as they conceive of its boundaries. Often, there was not a readily accessible and official map that we could use that defined that boundary; so where the reader has this need, we urge the reader to look for other geographies in our datasets that can be easily adapted to their needs, either one that is similar enough to their preferred geography or by aggregating several smaller geographies together to match your preferred geography.
We also want to caution subsequent users of this data that some geographies change frequently and others change rarely, so they should note the vintage of the maps we used to produce each table. For example, county boundaries change very rarely, and when they do, it is often in extremely small ways. On the other hand, legislative districts may change frequently and significantly, so depending on your goals some specific tables may be more or less applicable for your future use.
Finally, readers should note that occasionally the incarcerated numbers in our tables for some geographies may not always sum precisely to the total 21,019 home addresses used in this report. That discrepancy arises because of how census blocks — the basic building block of legislative districts — nest or fail to nest within geographies drawn by agencies other than the Census Bureau.
Footnotes
The Prison Policy Initiative recently published twelve similar state reports (available at https://www.prisonpolicy.org/origin/) using those states’ redistricting data to fill this need in those states. Those reports inspired this report, which does not use redistricting data, but data obtained by Voice of the Experienced (VOTE) from the Louisiana Department of Public Safety & Corrections. ↩
Imprisonment rates per 100,000 are a useful tool for comparison between different geographic regions with varying population sizes. For example, using a rate per 100,000 allows us to compare the frequency of imprisonment between the most populous Louisiana parishes like East Baton Rouge — with over 450,000 residents — to the smaller, less populated parishes, like any one of the 50 Louisiana parishes with less than 100,000 residents. The denominator for this rate is the population change after subtracting away the incarcerated population contained in the file and adding back in any incarcerated whose last known address was in that area. ↩
American Indian and Alaska Native areas (AIANAs) are geographies defined by the Census Bureau and across the country, these areas include reservations and trust lands, tribal jurisdiction statistical areas, Alaska Native Regional Corporations, Alaska Native village statistical areas, and tribal designated statistical areas. In Louisiana, there are American Indian reservations and state designated tribal statistical areas (SDTSAs). ↩
While we do not publish neighborhood-level data for all cities or communities in Louisiana, a local-level analysis of community incarceration trends could be conducted using the imprisonment rates by census tracts, published in the appendix. ↩
As we discuss in the methodology, not everyone in Louisiana Department of Public Safety & Corrections’ custody could be reallocated to a home address — for example people incarcerated in Louisiana who are residents of other states — and there were also addresses on file that were not, for a variety of reasons, able to be reallocated back to specific places in Louisiana. ↩
As explained in the methodology, this report’s imprisonment rate is based on the number of people in the custody of the Louisiana Department of Public Safety & Corrections that we reallocated to their home addresses. This number is necessary for making apples-to-apples comparisons of imprisonment between specific Louisiana communities and the state as a whole. For the purposes of comparing incarceration in Louisiana with that of other states, other more common metrics would be more useful. For these other uses, we would recommend using other numbers for the statewide incarceration rate, likely either the 564 per 100,000 published by the Bureau of Justice Statistics in Prisoners in 2021 for the number of people in state prison per 100,000 residents, or our more holistic number of 1,094 per 100,000 residents used in States of Incarceration: The Global Context 2021 that includes people in state prisons, federal prisons, local jails, youth confinement, and all other forms of incarceration. ↩
The state of Louisiana is divided into parishes, which are analogous to counties in other states and are considered county-equivalents by the U.S. Census Bureau. ↩
For more information on New Orleans’ history of redlining and blockbusting, see: How ‘redlining’ shaped New Orleans neighborhoods — is it too late to be fixed?. For a detailed analysis of racist housing policies and exclusionary zoning policies, see Rigging the Real Estate Market: Segregation, Inequality, and Disaster Risk; and for more on the local effects of Jim Crow laws on neighborhood segregation, see Jim Crow: In 1950, lives separated by law. ↩
The Othering & Belonging Institute at the University of California, Berkeley offers a comprehensive and succinct summary of the consequences of racial segregation and environmental racism in New Orleans, with references to other research and resources. For a more in depth exploration of these patterns, we recommend their City Snapshot: New Orleans and their national segregation report, The Roots of Structural Racism Project. ↩
In this assessment of imprisonment rates in New Orleans’ neighborhoods, we are comparing neighborhoods with populations of at least 1,000. This population cutoff excludes two neighborhood statistical areas in the city: the Florida Housing Development (total population of 169, with 9 of those residents imprisoned) and Lake Catherine (contains the Bayou Sauvage National Wildlife Refuge and has a total population of 890, with three of those residents imprisoned). ↩
This neighborhood is named after and contains the B.W. Cooper apartments, a housing project built in the 1930s. Much of this area has been redeveloped and the neighborhood encompasses a handful of city blocks just west of the Superdome. ↩
The low incarceration rates of college neighborhoods are not unique to Baton Rouge. There are similar trends in New Orleans: the Audubon-University neighborhood that contains Tulane University (with almost 50% of residents aged 18-34, compared to 25% in the city as a whole) has the lowest imprisonment rate across all 72 New Orleans neighborhoods: 29 per 100,000. ↩
The historic I-49 division of Shreveport is not insignificant: the east side communities are home to more white people than the rest of the city, and tend to have higher median incomes and lower rates of poverty, while the west side consists of predominantly low-income neighborhoods with much larger Black populations.
Racial and environmental justice advocates have long been vocal about the negative consequences of the I-49 division of Shreveport, even describing it as “an impenetrable and permanent barrier, a living monument to segregation.” In other parts of Shreveport, residents are opposing the long-threatened construction of the I-49 City Connector that would disrupt the historically Black Shreveport neighborhood of Allendale. In January 2023, residents learned that this stretch of highway would not be built, but the fight to prevent the construction of highways at the detriment of Black communities in Shreveport continues. For more on this, see A Highway Continues to Haunt Shreveport, Louisiana published by the nonprofit media advocacy organization Strong Towns. ↩These impacts of incarceration on families and communities include higher rates of disease and infant mortality, housing instability, and financial burdens related to having an incarcerated loved one. For more detailed information on how incarceration impacts families and communities, see On life support: Public health in the age of mass incarceration from the Vera Institute of Justice. ↩
These various correlative findings are once again in line with previous research on health disparities across communities, which have been linked to neighborhood factors such as income inequality, exposure to violence, and environmental hazards that disproportionately affect communities of color. Public health experts consider community-level factors such as these — including incarceration — “social determinants of health.” To counteract these problems, they suggest taking a broad approach, addressing the “upstream” economic and social disparities through policy reforms, as well as by increasing access to services and supports, such as improving access to clinical health care. ↩
We also know that people who have been incarcerated have a shorter life expectancy than people who have not. ↩
There are many additional studies linking incarceration rates and high community rates of STIs, including gonorrhea and chlamydia in North Carolina. ↩
Asthma prevalence has been used as a tool to measure population health in both sociological and public health research because it is easily correlated with environmental factors, like air quality and triggers (i.e. second hand smoke, mold, dust, cockroaches, dust mites), access to appropriate healthcare, and healthcare literacy. See the American Lung Association’s Public Policy Position for a literature review of the relevant public health research. ↩
Again, this finding is consistent with previous research on the relationship between education and imprisonment rates. We previously reported that the high school educations of over half of all formerly incarcerated people were cut short. This is in line with earlier studies showing that people in prison have markedly lower educational attainment, literacy, and numeracy than the general public, and are more likely to have learning disabilities. We also know there are relationships between parental incarceration and educational performance. ↩
Of note, this dataset includes all people in the custody of the Louisiana Department of Public Safety & Corrections on a single date in 2022 and does not include any people in federal Bureau of Prisons custody.
In 2022, a monthly average of 50% of people in the custody of the Department were incarcerated in local correctional facilities rather than state correctional facilities. In a 2016 analysis, the Prison Policy Initiative found that 75% of jail cells in Louisiana local jails are rented to the state to house people for the state Department of Public Safety & Corrections who have been sentenced to state prison time. Since these people are still in the custody of the state — even though they are physically in a local facility — we included them in our analysis of where incarcerated people in Louisiana are from. In contrast, people who were detained pretrial in local facilities or serving short jail sentences in local facilities are not included in this analysis. ↩This level of detail is irrelevant to the findings of this report about the spatial concentrations of incarceration in Louisiana; but may be useful to the state redistricting officials or the Census Bureau who are considering various reforms to end the problem of prison gerrymandering. For these officials, having additional detail about the current “quality” of the home address data held by the prison system in Louisiana — or in other states — can be invaluable. Of course, “quality” is of course not an absolute measure and instead depends on the goals of the project. For example, there were records that lacked a last known address and therefore could not be mapped, but with enough future notice the prison system could collect better data from those individuals if it wished to. But the 1,071 records that contained out-of-state addresses would be irrelevant to this project seeking to determine where in Louisiana people in state prison come from, but would be relevant and useful to the Census Bureau should that agency want to count incarcerated people as residents of their home addresses nationwide.
The criteria Redistricting Data Hub and VOTE used to filter out records, the order in which they applied those filters, and the number of records that were filtered at that stage of the work is as follows (in the case of the records without a zipcode, Redistricting Data Hub ultimately identified and restored 332 records in the next step of the methodology using rooftop or range interpolation):- Out of state addresses (1,071)
- Detained in non-physical facilities, or probation or parole offices (262)
- No last known address (1,966)
- Last known address was a correctional facility (83)
- Invalid address or listed address as “homeless” (329)
- Only contained a street name (11)
- Did not contain a city (18)
- Did not contain a zipcode (416
- Addresses geocoded back to a census block that contained a correctional facility (128)
About the organizations
Voice of the Experienced (VOTE) is a grassroots organization founded and run by formerly incarcerated people (FIP), their families, and allies. Based in Louisiana, the organization is dedicated to restoring the full human and civil rights of those most impacted by the criminal (in)justice system. Together its members have the experience, expertise and power to improve public safety in Louisiana and beyond without relying on mass incarceration. People with convictions are able to achieve real rehabilitation and reentry when their full human and civil rights are restored. The specific rights the organization addresses are: employment rights, housing rights, medical rights, and voting rights. The organization believes those are the most crucial building blocks of life after incarceration, yet its daily organizing covers a wide variety of intersecting issues. They strategically develop formerly incarcerated leaders to be the champions of reforms through community education, civic engagement, and policy advocacy. This is how VOTE helps pave the path to truly ending mass incarceration.
The non-partisan Redistricting Data Hub provides individuals, civic organizations, and good government groups the data, resources, and knowledge to participate effectively in redistricting processes by learning how to define their communities, provide meaningful public input, recognize gerrymandering, and advocate for fair and legal maps. In service of this mission, it hosts over 15,000 datasets across all 50 states, from the census block to the district level, and continues to add new data that is useful for map drawing and analysis. This data is free to the public, and accompanied by technical support and nonpartisan analysis on request.
The non-profit, non-partisan Prison Policy Initiative produces cutting-edge research that exposes the broader harm of mass criminalization and sparks advocacy campaigns that create a more just society. Through its work, it has used innovative research techniques to show both that mass incarceration harms all communities and that this burden falls disproportionately on communities of color and poor communities.
