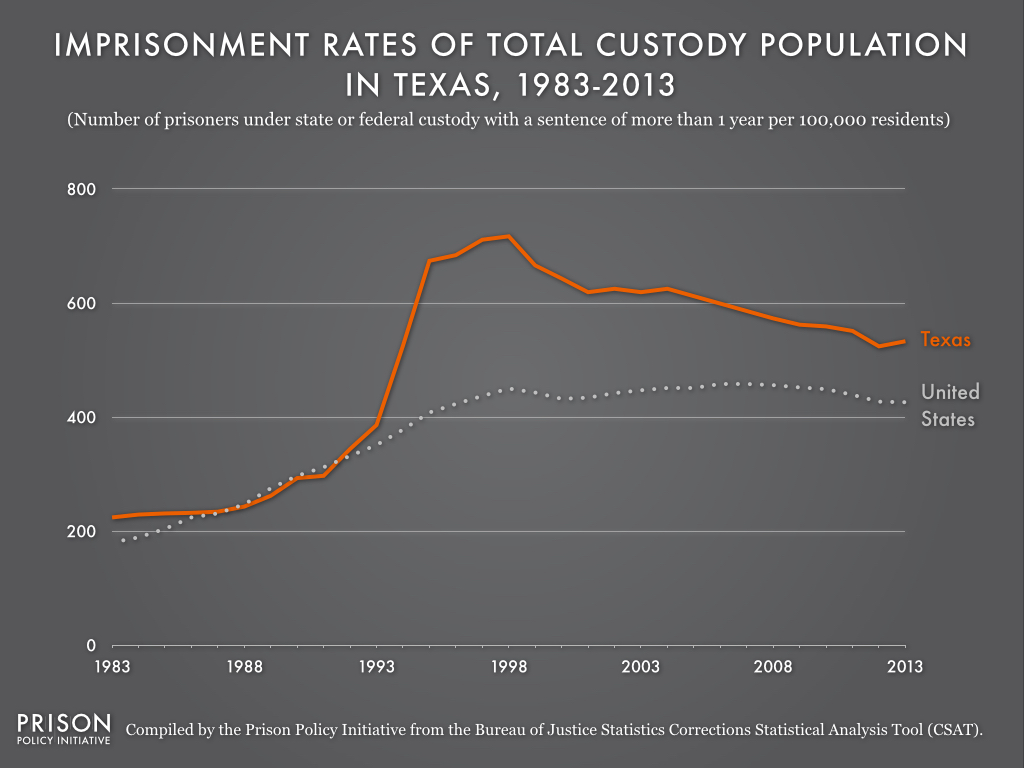
Data Source: Compiled by the Prison Policy Initiative from the Bureau of Justice Statistics Corrections Statistical Analysis Tool (CSAT). (Graph: Rachel Gandy, 2015)
This graph originally appeared in Explaining Texas' overnight prison boom.
Throughout the 1980s, the Texas imprisonment rate closely matched the national imprisonment rate. But between 1993 and 1998, the Texas imprisonment rate almost doubled, causing Texas’ total custody population to quickly escalate.


