Across the globe, the 25 jurisdictions with the highest rates of incarcerating women are all American states. Thailand, at number 26, is the first non-U.S. government to appear on this high-end list, followed closely at number 27 by the United States itself. The next 17 jurisdictions are also American states.
Overall, with the exception of Thailand and the U.S. itself, the top 44 jurisdictions throughout the world with the highest rate of incarcerating women are individual American states.
Nearly 30% of the world's incarcerated women are in the United States, twice the percentage as in China and four times as much as in Russia.
Putting U.S. states in a global context is sobering; even the U.S. states that have comparatively low rates of incarceration far out-incarcerate the majority of the world.
Illinois' incarceration rate for women is on par with El Salvador, where abortion is illegal and women are routinely jailed for having miscarriages. New Hampshire is on par with Russia, and New York with Rwanda.
Rhode Island, which has the lowest incarceration rate for women in the U.S.,1 would have the 15th highest incarceration rate in the world if it were a country. In other words, only 14 countries (not including the United States) incarcerate women at a higher rate than Rhode Island, the U.S. state that incarcerates women at the lowest rate of imprisonment.
Outpacing our peers
As we report, the United States incarcerates women at a rate similar only to Thailand. But looking instead to our international peers, exactly how does the U.S. measure up with other nations?
For comparison we use some of our closest allies, the founding countries of the North American Treaty Organization (NATO). These NATO countries incarcerate women at a rate eight to twenty-five times lower than the United States as a whole: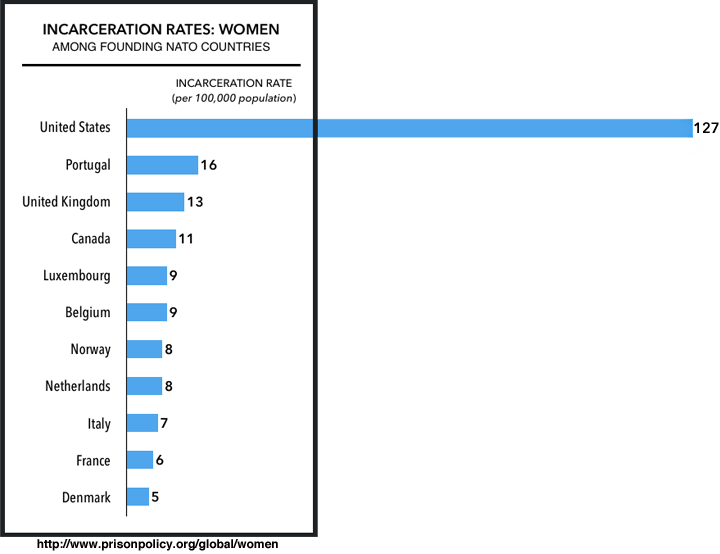
As we have noted, Rhode Island has the lowest women's incarceration rate in the U.S., but it still has a rate more than twice that of Portugal, which has the second highest rate of incarcerating women among founding NATO nations. Nationally, the U.S. incarcerates women at a rate eight times higher than Portugal.
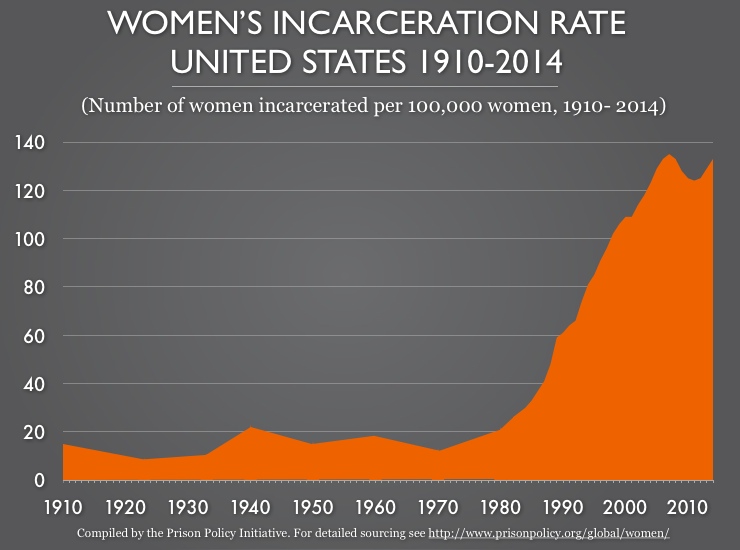 The United States’ incarceration rate for women is currently more than eight times higher than it was throughout most of the 20th century.
Outpacing ourselves
In the U.S., we are not only incarcerating women far more than nearly all other nations, but we are also incarcerating women far more than we have done in the recent past. The sudden growth of incarceration in our country has been staggering; our incarceration rate nearly tripled between 1980 and 1990.
Our own history demonstrates that high rates of incarceration are not an essential part of American policy; rather they are the outcomes of a series of now regrettable policy choices by federal, state and local officials in the last three decades.2
Conclusion
Currently prisons and jails in the U.S. confine approximately 206,000 women (at a rate of 127 per 100,000). Within the U.S., it is commonly noted that women are incarcerated far less frequently than men, but comparing women's incarceration rate to that for men paints a falsely optimistic picture. When compared to jurisdictions across the globe, even the U.S. states with the lowest levels of incarceration are far out of line.
The statistics revealed by this report are simple and staggering. They suggest that states cannot remain complacent about how many women they incarcerate. Women should be a mainstay of any state policy discussions on the economical and effective use of incarceration if we hope to incarcerate fewer women.
About the data
This report compares the prevalence of incarceration in individual U.S. states with other countries, and therefore brings together data on the number of women incarcerated in states and countries as a portion of the states' or countries' total female populations. This report also puts together several different datasets to show the growth of the incarceration rate for women in the United States over time.
U.S. State data:
We choose to use U.S. Census data because we wanted to be sure to include all the forms of incarceration in the United States. (The Bureau of Justice Statistics has not published state-level estimates of the U.S. jail population — which makes up 30% of the total mass incarceration pie — since 2006.) We used U.S. Census 2010 data that shows the total number of people in each state who are confined in local, state, and federal adult correctional facilities. The women's population was calculated by aggregating female population reported for all age groups in these adult correctional facilities.
This powerful census dataset comes with one quirk worth discussing: the Census Bureau counts incarcerated people as if they were residents of prison locations rather than their home communities. In the case of state prison systems that send a large number of people to prisons in other states, or in the context of federal prisons, this Census Bureau residence determination can influence a state's incarceration rate calculated with that data. A significant portion of West Virginia (61%), Connecticut (51%) and Minnesota's (43%) female prison population appear to be women in federal facilities located within the state's borders. We did not attempt to factor out these populations for two reasons. First, as a practical matter, systematically disentangling the Census Bureau's reported incarcerated populations into discrete jurisdictional categories is impractical. And secondly, federal prisons are not sited randomly; states which host federal prisons are active partners in buoying incarceration.
Country data:
The women's incarceration rate for each country was calculated using two incarceration datasets from the Institute for Criminal Policy Research and population data from the United Nations and other sources.
The number of women incarcerated in each country was calculated based on the Institute for Criminal Policy Research's World Prison Brief's Highest to Lowest - Female prisoners (percentage of prison population) which provided the percentage of each country's incarcerated population that is female, and the corresponding list of incarcerated population totals for each country.3 (For some countries, the World Prison Brief includes some number of girls in the numbers of incarcerated women.)
For most countries' women's population we relied on the United Nations' World Population Prospects: The 2015 Revision, Total Population - Female file. For Taiwan and countries within the United Kingdom, the UN's World Population Prospects and the ICPR's World Prison Brief were incompatible, so we relied on individual country censuses for female population totals for each jurisdiction. We used Taiwan's 2010 Census, and for the United Kingdom, England & Wales, Northern Ireland, and
Scotland (Year 2011, Table DC1117SC).
We were unable to calculate the rate of incarceration for women in four jurisdictions within the former Yugoslavia. The World Prison Brief publishes incarceration data separately for Serbia and Kosovo, and Bosnia and Herzegovina: Federation and Bosnia and Herzegovina: Republika Srpska separately, but reliable female population counts are only available for each pair of jurisdictions combined, so we could not calculate an incarceration rate.
Finally, to make the comparisons in this report more meaningful, we've chosen to only include nations with a total population of at least 250,000 women. For that reason, Iceland, which is also one of the original NATO founders, is not included in the NATO graph, or the full list above. For those interested, Iceland's incarceration rate is lowest among the NATO founders, at 3 per 100,000.
U.S. historical data:
The historical graph was calculated using different datasets that included women in all types of correctional facilities (including jails) and the total U.S. women's population for the corresponding year.
Historical data for the number of women incarcerated in prisons 1910 and 1923 was calculated based on incarceration data from the Bureau of Justice Statistics' Historical Corrections Statistics in the United States, 1850-1984 (Table 3-31. Characteristics of Persons in State and Federal Prisons). The data for 1933 through 1970 came from Bureau of Justice Statistics' State and Federal
Prisoners, 1925-85 (Table 1. Sentenced prisoners in State and Federal institutions: Number and incarceration rates, 1925-85). And data for 1980 through 2014 came from the Bureau of Justice Statistics' National Prisoner Statistics Program, Sentenced female prisoners under the jurisdiction of state or federal correctional authorities, December 31, 1978-2014 (XLSX).
The historical numbers of women incarcerated in jails is also based on multiple sources.
For 1910 through 1980 and 1982 we calculated the number of women incarcerated in jails based on Bureau of Justice Statistics' Historical Corrections Statistics in the United States, 1850-1984 (Table 4-15. Characteristics of Persons in Jails). (We were unable to identify any source for the number of women incarcerated in jails in 1981.) From 1983 to 1994, Bureau of Justice Statistics' Sourcebook of Criminal Justice Statistics - 1994 (Table 6.11 Number of Jail inmates, average dally population, and rated capacity: By legal status and sex, United States, 1983-94). For years 1995 through 1999, and 2001 through 2004, the number of incarcerated women in jails was calculated from the Sourcebook of criminal justice statistics Online's Table 6.17.2012, Jail inmates, By sex, race, Hispanic origin, and conviction status, United States, 1990-2012 and Table 6.1.2011, Adults on probation, in jail or prison, and on parole United States, 1980-2011. And numbers for 2000 and 2005 through 2014 are from Bureau of Justice Statistics' Jail Inmates at Midyear 2014 (Table 2. Number of inmates in local jails, by characteristics, midyear 2000 and 2005-2014).
From the data above, we calculated the total number of women incarcerated in each year, but in order to calculate the rate of incarceration, we also needed the total number of women in the U.S. for each year. Population data until 1980 and for 1990, was calculated based on sex ratios from the Census Bureau's Demographic Trends in the 20th Century Census 2000 Special Reports (Table 6. Population by Sex for the United States, Regions, and States: 1900 to 2000, Part B. Female) and the total U.S. population reported by the Census Bureau. The sex ratios were reported decennially, so for 1923 and 1933 we estimated the ratio based on an adjusted percentage of change between the bookend decades that were reported. Starting with 1980 (except for 1990), we took the female population numbers directly from the U.S. Census Bureau's intercensal estimates and decennial census counts. Total female U.S. population for 1982 through 1989 came from the Census Bureau's Quarterly Population Estimates, 1980 to 1990 and the data for 1991 through 1999 came from the Census Bureau's Intercensal Estimates (1990-2000), and 2000 through 2014 from the Census Bureau's American FactFinder.
About the authors
The non-profit, non-partisan Prison Policy Initiative produces cutting edge research to expose the broader harm of mass criminalization, and then sparks advocacy campaigns to create a more just society. This report was prepared by Aleks Kajstura, Legal Director of the Prison Policy Initiative, and Russ Immarigeon, an independent researcher and editor of the two-volume set, Women and Girls in the Criminal Justice System: Policy Strategies and Program Options (Civic Research Institute, 2006, 2011).
Acknowledgements
We extend a special thanks to
Josh Begley for his innovative work on
States of Incarceration: The Global Context, upon which this report relied, and Elydah Joyce for her work on the NATO graphic.
Stay Informed
Get the latest updates by signing up for our newsletters: