The Right Investment?: Corrections Spending in Baltimore City
by the Justice Policy Institute and the Prison Policy Initiative
February 2015
Introduction: Mapping Baltimore’s
Corrections and Community Challenges
With more than 20,000 people in prison1 and at a cost of almost one billion dollars a year, Maryland’s corrections system consumes significant public resources. Knowing more about the impact incarceration has on communities would help state policymakers and residents make more informed choices on better ways to invest taxpayer resources in more effective public safety strategies and opportunities to help people succeed.
As a result of Maryland’s historic “No Representation Without Population Act,” which ended the practice of “prison gerrymandering” and required incarcerated people to be counted at home for redistricting purposes, it is finally possible to know where the people in Maryland’s prisons are from.
Focus on Baltimore City
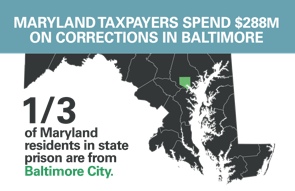
Baltimore City and, specifically, certain communities within Baltimore, are ground zero for Maryland’s incarceration challenge: While one out of 10 Maryland residents is from Baltimore, one out of three Maryland residents in state prison is from the city. With an incarceration rate three times that of the State of Maryland and the national average, Baltimore is Maryland’s epicenter for the use of incarceration. Rates of incarceration are highly concentrated in certain communities, with a handful of communities experiencing even higher concentrations. For example, at the high end there are 458 people in prison from the Sandtown-Winchester/Harlem Park community,2 located in West Baltimore. At the low end, there were only three people in prison from the Greater Roland Park/Poplar Hill community in North Baltimore.
Maryland taxpayers spend nearly $300 million3 each year to incarcerate people from Baltimore City. This includes as much as $17 million to incarcerate people from a single community, Sandtown-Winchester/Poplar Hill.
| Jurisdiction | Number of people in prison (2010) | Census population (2010) | Incarceration Rate |
|---|---|---|---|
| Baltimore City | 7,795 | 620,961 | 1,255 |
| Maryland | 22,087 | 5,773,552 | 383 |
| United States | 1,404,032 | 308,745,538 | 455 |
Spending hundreds of millions of dollars to lock up Baltimore residents, rather than investing in their long-term well-being is reflected in an array of challenges facing Baltimore communities.
Drawing upon rich data sets about Baltimore City communities, this report illustrates how the communities most impacted by incarceration fare on several indicators of community well-being: employment, educational attainment, addiction, physical health, housing and public safety.
Combining indicators of community well-being, data showing where people in Maryland’s prisons are from and the cost of incarcerating these people shows that the communities in which taxpayers spend the most on incarceration are in need of different resources and represent the greatest opportunity for more effective investments that will more likely promote community well-being and result in safer communities.
This report is organized into three frames for understanding the concentration of incarceration and, perhaps most importantly, the opportunity for different community investments:
- Baltimore’s 25 “high” incarceration communities: About half the 55 communities that comprise Baltimore City experience a concentrated impact of incarceration. At least $5 million is being spent by taxpayers to incarcerate people from each of these communities. Other indicators of community well-being show that, overall, the 25 high incarceration communities experience higher unemployment, greater reliance on public assistance, higher rates of school absence, higher rates of vacant and abandoned housing, and more addiction challenges than the city as a whole. These 25 high incarceration communities also experience lower life expectancy, lower rates of educational attainment, and lower incomes than other parts of Baltimore. More residents of these communities spend more time commuting than other city residents, a clear sign that people in high incarceration communities are distanced from opportunity.
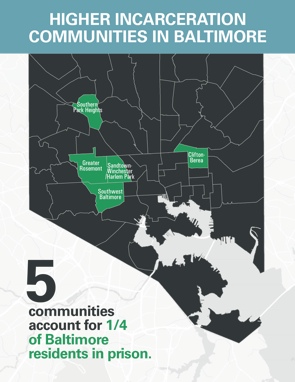
- Baltimore’s 5 “higher” incarceration communities: Among the 25 high incarceration communities, there are five places—the higher incarceration communities—where taxpayers spend $10 million or more imprisoning people from these communities. These five “higher” incarcerated communities experience even more unemployment, high school absence, more emergency narcotics calls to 911 and higher rates of vacant or abandoned housing. These five higher incarceration communities have a life expectancy that is 13 years shorter than the five communities with the fewest number of people in prison.
- Baltimore’s “highest” incarceration community: One community stands out as being the “highest” incarceration community: Maryland taxpayers spend $17 million each year to incarcerate residents of Sandtown-Winchester/Harlem Park. This community faces extraordinary challenges around educational attainment, housing, and addiction. Seven percent of the children in this community have elevated blood-lead levels—a critical indicator of substandard housing and a cause of negative outcomes for young people. By contrast, 47 of Baltimore’s 55 communities report not a single child having elevated blood-lead levels.
Public Safety: Making the right investment
For 30 years, policymakers in Maryland and across the country acted on the premise that building more prisons and making prison sentences longer would make communities safer. In the last 10 years, crime rates have fallen to 1960s-levels. While cities and states across the country, including Baltimore and Maryland, have experienced significant crime reduction, there has not been a similar drop in incarceration.4 In fact, the same communities where taxpayers spend the most on incarceration also have higher rates of violent crime than other parts of the city. Simply locking more people up and spending more money on incarceration does not necessarily mean a safer community.
With no guarantee that increased incarceration leads to long-term community safety, but every indication that incarceration disrupts lives, families, and communities, continued investment in prisons is questionable. This report is intended to explore what it means to have safe and healthy communities and discuss the role of taxpayer investments in public services as a way to build safer, stronger communities in the long-term.
For a person or community to thrive, avoiding justice system involvement or becoming a victim of crime is the absolute minimum requirement. A healthy and safe community is one where residents are employed, earn a high enough income to purchase basic services, have high levels of educational success, live long and healthy lives, and spend less time commuting. Baltimore City and the State of Maryland should refocus resources and attention on those communities with the highest levels of correctional involvement to ensure that the people that live there can realize these basic goals.
| What could Baltimore City communities buy instead of incarceration? | ||
| Cost per person | Number that could be served for $37,000 | |
|---|---|---|
| Drug Treatment for Adults | $4,494 | 8 people |
| Employment Training | $5,000 | 7 people |
| Housing (per month) | $1,252 | 30 families |
| GED Course | $1,000 | 37 people |
Key recommendations include:
- Make investments in opportunity: Create a portfolio with better long-term returns on investment. Baltimore City already has a number of resources available to help people get self-sustaining jobs, obtain an education, get stable housing, and access treatment. For the cost of sending one person to prison for a year, Baltimore City could pay for half of a high school teacher’s annual salary, employment training for seven people, two-bedroom apartments for 30 families for one month, or a GED course for 37 people.
- Reduce spending on prisons: Free up public resources for long-term solutions to address public safety. Maryland should follow the lead of other states that have enacted wholesale sentencing reform, systemic reforms to reduce imprisonment, and redirection of funds to treatment. A portion of the hundreds of millions of dollars spent on incarceration in Baltimore should be redirected—and additional funds could be invested—to support locally-driven services, supports and opportunities that meet the unique needs of the communities they serve, especially related to work, education, health, and housing.
- Do not spend more money on incarceration: Find alternatives to jail expansion. Any prison or jail expansion plan5 should be carefully scrutinized. Rather than exacerbating the ongoing challenges in Baltimore’s communities, policymakers should examine ways to direct resources to more effectively address community challenges to reduce the number of people incarcerated in the long-term. A number of pretrial reforms that can help keep jail populations low have already been proposed to state policymakers.
- Develop research capacity to analyze the costs and benefits of policy choices: Opportunities for data and analysis. In other states, like the state of Washington, legislators and the executive have the capacity to develop cost-benefit analyses of any criminal justice initiative to test whether prison sentences are getting the public the bang for the buck they expect. Maryland should make modest investments in the state’s ability to collect and analyze data, and conduct cost-benefit analyses on criminal justice and social policy. With these kinds of tools, policymakers and the public could weigh the costs and benefits of current and future criminal justice policies.
Opportunities and limitations
While this report adds important and new findings to an array of policy analysis, advocacy, and knowledge about Baltimore City, it is not without its challenges. The data included in the report also present new opportunities for further analysis of incarceration trends in Baltimore City and the State of Maryland.
This report does not closely examine racial and ethnic disparities in Baltimore, but the intensity of the impact of incarceration is felt more in communities of color. While Sandtown-Winchester/Harlem Park has the most people in prison, it is also 96.6 percent Black/African American. The community with the fewest people in prison, Greater Roland Park/Poplar Hill, is 77.5 percent White, 9.8 percent Asian, and 7.9 percent Black/African American. Communities of color most acutely experience the consequences of taxpayer dollars spent on incarceration.
This report encourages Maryland taxpayers to question whether continued spending on incarceration is wise, when other investments could be made to better benefit the state and the City of Baltimore. This report is an important first step – a detailed geographic analysis of incarceration in Maryland communities.
There is far more work that can and should be done with this data to shed light on incarceration’s impact on communities. Data available in the Appendix of this report and online encourage additional analysis.
Indicators of Lost Opportunity
Like other cities, the movement of residents to the suburbs has been reversed by an influx of new opportunities in Baltimore City, including new kinds of jobs (such as the expansion in financial services), new housing (such as condominiums in the city core and waterfront), and improvements in urban transportation along commercial lines (such as the Charm City Circulator). Some residents of Baltimore City are now able to take advantage of a walkable city that is increasingly healthy and safe.
But like a lot of cities, growth has been uneven, and opportunity has not been available for everyone. And like a lot of cities, the disparity in access to opportunity runs across racial and ethnic lines. A recent Brookings Institute report indicates that concentrated poverty is difficult to reverse across generations,6 and contributes to a variety of poor life outcomes, including incarceration. More than 40 percent of the Baltimore Metro area population resides in an area where 20 percent or more of residents live in poverty and, of those, more than 10 percent resides in an area where 40 percent or more residents live in poverty.7
This report links the data on the concentration of incarceration with key indicators of community well-being published by the Baltimore Neighborhood Indicators Alliance (BNIA), and finds that leading indicators of community distress coincide with the concentration of incarceration. BNIA collects over 150 social indicators about each community in Baltimore, publishes this information online, and works with community organizations and government to use this information to improve policy in Baltimore. This report uses 12 of the 150 available indicators, including:
- Unemployment and commute time: Employment is critical to helping people succeed and build strong, safe communities.8 Overall, employment in Baltimore City continues to lag behind the rest of the state of Maryland. While the state had an average unemployment rate of 5.9 percent in 2014,9 Baltimore City’s unemployment rate for that same year was 8.7 percent.10 Though this is a decrease from a recent average high of 11.8 percent in 2010, it is still higher than the state average. In addition, long commute times represent a lack of opportunity and the challenges a person might have accessing work in a particular community. The percent of the population aged 16-64 not employed11 and the percent of the employed population with travel time to work of 45 minutes or more are both important indicators used to explore the dimensions of employment challenges.
- Income and public assistance: Simply having a job is not enough; a person must be able to earn enough money to support a family. This is a particular challenge in cities where any economic growth coincides with an increase in the cost of basic expenses like housing, transportation, and other living expenses. While public support in the form of Temporary Assistance to Needy Families (TANF) can provide income assistance where the economy fails to produce enough good jobs, ideally, families will have access to employment with adequate wages. Median household income and the percent of families receiving TANF are two indicators used to show the challenges that these same high incarceration communities face in generating and sustaining the income levels needed to support a strong, healthy community.
- Educational attainment: Education has a variety of benefits related to health, civic engagement, and social engagement,12 but perhaps most importantly, educational attainment is the foundation for access to well-paying employment. For people returning to the community from prison, education and job training is particularly important. Nationally, about two-thirds of people in prison do not have a high school diploma.13 The percent of the population 25 years and over with less than a high school diploma or GED and percent of 9th and 12th grade students that are chronically absent are the indicators indicative of community challenges related to educational attainment.
- Addiction: Research shows that addiction can interfere with a person’s ability to get and keep a job, maintain housing, get an education, and stay out of prison.14 Access to treatment in the community is an important component of community health. In the absence of data about the number of people in need of treatment, this report uses the number of narcotics calls as a proxy indicator for drug treatment challenges.
- Physical hHealth: Good physical health is critical to holding a job or attending school regularly.15 The Urban Institute reports work-limiting physical and behavioral health as the second most cited barrier to work after lack of education.16 Because people with shorter lifespans are less likely to be in good health, this report uses mortality for young people ages 15-24 and average life expectancy as indicators of good health.
- Housing: Stable, quality housing is the foundation for a variety of other activities, such as working, going to school, and maintaining good health. In addition, the presence of empty and abandoned houses has been found to be correlated with community disassociation, which also correlates with higher levels of incarceration and lower levels of employment and education.17 Quality housing is just as important as availability of housing. Lead is often found in lower-quality, deteriorating housing18 and has been found to affect a child’s brain development, negatively impacting the ability to learn and interact with others.19 Percentage of residential properties that are vacant and abandoned and percent of children age 0-6 with elevated blood-lead levels are indicators of unavailable or poor-quality housing.
- Public safety: Research has shown that communities from which many people move or are removed—when sent to prison, for example—struggle to form a sense of unity and cohesion, which can contribute to higher crime rates. Specifically, communities with the highest levels of justice involvement also tend to see higher rates of violent crime.20 To provide additional context related to the safety and well-being of high incarceration communities, the report includes violent crime rates per 1,000 residents as an indicator.
The indicators included here suggest that the same communities that have the most people in prison also struggle with employment, education, addiction, housing, health, and public safety. Overall, these associations appear to grow stronger as the number of people in prison from that community increases. Ten out of 12 indicators in this analysis worsened as the number of people in prison increased from the 25 “high” incarceration communities to the 5 “higher”, and 1 “highest” incarceration communities.21
| As the number of people in prison increases, on average, indicators of community well-being worsen. | ||||
| 55 Communities in Baltimore City | 25 High Incarceration Communities | 5 Higher Incarceration Communities | 1 Highest Incarceration Community | |
|---|---|---|---|---|
| Number of People in Prison | 7,795 | 5,941 | 1,874 | 458 |
| Total Estimated Cost of Incarceration | $288,304,000 | $219,817,000 | $69,338,000 | $16,946,000 |
| Percent 16-64 Not Employed * | 39 | 47 | 52 | 52 |
| Percent of Employed Population with Travel Time to Work of 45 Minutes or More | 20 | 25 | 30 | 32 |
| Median Household Income | 40,803 | 32,050 | 26,164 | 24,006 |
| Percent of Families Receiving TANF | 11 | 17 | 22 | 25 |
| Percent Population (25 years and over) With Less Than a High School Diploma or GED | 20 | 26 | 30 | 34 |
| Percent of 9th-12th Grade Students that are Chronically Absent | 40 | 44 | 49 | 49 |
| Life Expectancy | 74 | 71 | 68 | 69 |
| Mortality by Age (15-24 years old) | 12 | 17 | 21 | 19 |
| Percentage of Residential Properties that are Vacant and Abandoned | 8 | 14 | 23 | 33 |
| Percent of Children (aged 0-6) with Elevated Blood-Lead Levels | 1 | 1 | 3 | 7 |
| Number of Narcotics Calls for Service per 1,000 Residents | 90 | 143 | 238 | 465 |
| Violent Crime Rate per 1,000 Residents | 15 | 19 | 21 | 23 |
The “High” Incarceration Communities:
What do we know about the 25 communities where Maryland taxpayers spend a total of $220 million — or about $5 million or more per community — to incarcerate people?
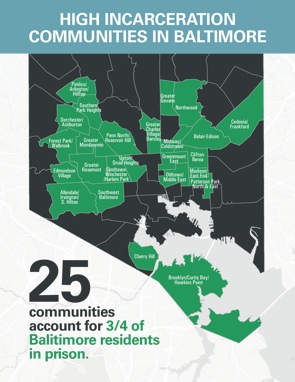
High incarceration communities are those places Maryland taxpayers spend about $5 million22 or more to incarcerate people from each of 25 Baltimore communities. These 25 communities include about half of the 55 communities in Baltimore City.
Together, these 25 communities account for 76 percent of the money spent on incarcerating people from Baltimore for a total of $220 million. Seven out of 10 Baltimore residents in a state prison in 2010 are from one of these 25 communities.
These communities have some of the highest incarceration rates in the city at 1,860 per 100,000, five times that of the state (383 per 100,000). These 25 communities are also places where residents face greater challenges compared to the entirety of the city.
These 25 communities tend to have:
- High unemployment: Nearly half of people aged 16-64 are not employed (47 percent), compared to the city average of 39 percent. (Includes not just those who are looking for work, but also those who are not working by choice or circumstance).
- Long commutes: Twenty-five percent of the people in these communities have an average travel time to work of 45 minutes or more, compared to 20 percent of all city residents.
- Low incomes: The average median income of these 25 high incarceration communities is $32,050. Comparatively, Baltimore City residents have an average median wage of $40,803.
- High rates of public assistance: On average, one in six (17 percent) of residents in these 25 communities receive TANF benefits, compared to one in nine (11 percent) of all the residents in Baltimore City.
- Low educational attainment: Of the people living in these 25 communities, 26 percent have less than a high school diploma or GED, while 20 percent of Baltimore City residents have less than a high school diploma or GED.
- High rates of school absence: In these 25 communities, 44 percent of high school students, on average, are chronically absent from school, compared to 40 percent of the city’s high school students.
- High rates of emergency narcotics calls: In these 25 communities, there were 14 emergency calls related to narcotics for every 100 people, compared to nine for every 100 people in the whole city.
- Low life expectancy: The average life expectancy in these 25 communities is 71, while the average life expectancy for all residents of the city is 74.
- High rates of vacant and abandoned houses: On average, one in seven (14 percent) of the houses in these 25 communities are vacant or abandoned, compared to one in 12 (8 percent) of the houses in the whole city.
- Higher rates of violent crime: If incarceration were an effective solution to crime, the high incarceration communities would be among the safest places in the city. Instead, the 25 high incarceration neighborhoods report 19 incidents per 1,000 while Baltimore City’s overall rate is 15 per 1,000 people.
The “Higher” Incarceration Communities:
What do we know about the five communities where Maryland taxpayers spend $10 million dollars or more on incarceration?
Five communities are home to one in four Baltimore residents in prison.
A disproportionate share (32 percent) of the people in the 25 communities mentioned previously come from just five “higher incarceration” communities. The five higher incarceration communities with a combined total of 1,874 people in prison are Sandtown-Winchester/Harlem Park, Southwest Baltimore, Greater Rosemont, Clifton-Berea, and Southern Park Heights. These five communities account for one in four people who are in prison from Baltimore City.
The five higher incarceration communities tend to have an even greater concentration of challenges than the 25 high incarceration communities in the previous section. The challenges of these higher incarceration communities include:
- Higher unemployment:23 Fifty-two percent of people between the ages of 16 and 64 in these five communities are not employed, compared to 39 percent of the whole city and 47 percent of the high incarceration communities. (Includes not just those who are looking for work, but also those who are not working by choice or circumstance).
- Lower incomes:24 The five higher incarceration communities have an average median income of $26,164, compared to an average median income of $32,050 in the 25 high incarceration communities, and a city average of $40,803. At the other end of the spectrum, the five communities with the fewest people in prison have an average median income of $82,601, three times that of the five higher incarceration communities.
- Higher rates of people on public assistance: About one in five families (22 percent) in the higher incarceration communities receive TANF, compared to one in six (17 percent) in the 25 high incarceration communities, and one in nine (11 percent) in the whole city. In the communities with the fewest people in prison, 8 in 1,000 (.8 percent) people in the community receive TANF.
- Lower educational attainment: Just less than a third (30 percent) of the people in the five communities with the most people in prison do not have a high school diploma or GED, compared to 26 percent of the people in the 25 high incarceration communities, and 20 percent of the people in the city. By contrast, about 6 percent of residents in the five communities that send the fewest people to prison have less than a high school diploma or GED.
- Higher rates of school absence: In the five communities that have the most people in prison, about half (49 percent) of high-schoolers are chronically absent from school, compared to 44 percent in the 25 high incarceration communities, and 40 percent in the whole city. In the communities with the fewest people in prison, 20 percent of high school students are chronically absent.
- Higher rates of emergency narcotic calls to 911: In 2012, there was one call made to 911 related to narcotics for every four residents (238 per 1,000) in the five higher incarceration communities. Comparatively, there were about 14 calls per 100 people (143 per 1,000) in the 25 high incarceration communities, and 9 calls per 100 people (90 per 1,000), on average, in the whole city. By sharp contrast, there is an average of 7 calls per 1,000 residents in the five communities with the fewest people in prison.
- Higher mortality rates of young people: The mortality rate among young people (15-24 year olds) in the five communities with the most people in prison was 21 per 1,000 young residents. In the 25 high incarceration communities, it is 17 per 1,000 and the whole city’s mortality rate is 12 per 1,000. Comparatively, the mortality rate of young people in the five communities with the fewest people in prison was three per 1,000 young residents.
- Lower life expectancy: The five communities with the most people in prison can expect to live two years less than people in the 25 high incarceration communities, five years less than the city average, and around 13 years less than the five communities with the fewest number of people in prison. Specifically, in Clifton/Berea, the community with the lowest life expectancy of the five higher incarceration communities, residents have a life expectancy of 66. In Greater Roland Park/Poplar Hill—which is among the lowest incarceration communities in Baltimore—residents live to be about 84.
- Higher rates of abandoned or vacant housing: In the five communities with the most people in prison, approximately one in four houses (23 percent) are vacant or abandoned, while one in 7 (14 percent) and one in 12 (8 percent) are vacant or abandoned. In contrast, one out of 1,000 (0.5 percent) houses in the communities with the fewest people in prison is vacant or abandoned.
- Higher rates of violent crime: The five neighborhoods with the most people in prison also report 21 incidents of violent crime per 1,000 people. Comparatively, the 25 high incarceration neighborhoods report 19 incidents per 1,000, and the whole city’s rate is 15 per 1,000 people. The five neighborhoods with the fewest people in prison report approximately two incidents of violent crime per 1,000.
The “Highest” Incarceration Community:
What do we know about Sandtown-Winchester/Harlem Park, where Maryland taxpayers spend $17 million dollars on incarceration in a year?
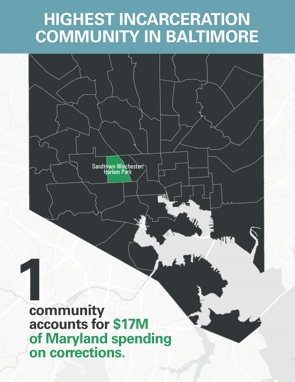
In the “highest” incarceration community, Sandtown-Winchester/Harlem Park, 3 percent of the total population is in prison. It has the third highest incarceration rate in Baltimore at 3,075 per 100,000; just behind Madison/East End, and Greenmount East. These 458 people account for $17 million in prison spending in Maryland.
Not only does Sandtown-Winchester/Harlem Park experience incarceration more intensely than other neighborhoods, it also faces the most concentrated challenges related to work, education, health, and housing:
- Higher unemployment: In the highest incarceration community, 52 percent of people aged 16-64 are not employed, consistent with the unemployment levels of the five higher incarceration communities, which is also 52 percent. By comparison, in the 25 high incarceration communities 47 percent of people aged 16-64 are not employed and the city’s average is 39 percent. (Includes not just those who are looking for work, but also those who are not working by choice or circumstance).
- Lower incomes: Sandtown-Winchester/Harlem Park had some of the lowest median household incomes in the city, at $24,006. Comparatively, average median household incomes for the five higher incarceration communities is $26,164, while the 25 high incarceration neighborhoods is $32,050, and the whole city is $40,803.
- Higher rates of people on public assistance: One out of four people in Sandtown-Winchester/Harlem Park (25 percent) receives TANF benefits. Comparatively, about one in five families (22 percent) in the five higher incarceration communities receive TANF benefits, one in six (17 percent) receive TANF benefits in the 25 high incarceration communities, and one in nine (11 percent) receive TANF benefits in the whole city.
- Lower educational attainment: Thirty-four percent of Sandtown-Winchester/Harlem Park residents do not have a high school diploma or GED, compared to 30 percent in the five higher incarceration communities, 26 percent in the high incarceration communities, and 20 percent in the whole city.
- Highest rate of emergency narcotic calls to 911: In Sandtown-Winchester/Harlem Park, there was nearly one narcotics call made for every two people (465 per 1,000 residents). In the five higher incarceration communities, there was one call made to 911 related to narcotics for every five residents (238 per 1,000 residents), 14 calls per 100 people in the 25 high incarceration communities, and less than 9 calls per 100 people, on average, in the entire city.
- Higher rates of abandoned or vacant housing: One out of every three (33 percent) houses in Sandtown-Winchester/Harlem Park is vacant or abandoned in 2012, compared with one in four (23 percent) in the five higher incarceration communities, one in seven (14 percent) in the 25 highest incarceration communities, and one in 12 (8 percent) in the whole city.
- Highest rate of elevated blood-lead levels: Seven percent of the children in Sandtown-Winchester/Harlem Park have elevated blood-lead levels. Comparatively, 85 percent of the communities—47 of the 55 community service areas in the city—report that no child living in the community has lead in their system
- Higher rates of violent crime: Sandtown-Winchester/Harlem Park reports 23 incidents of violent crime per 1,000 people. The five neighborhoods with the most people in prison also report 21 incidents of violent crime per 1,000 people, the 25 high incarceration neighborhoods report 19 incidents per 1,000, and the whole city’s rate is 15 per 1,000 people.
Making Investments in Opportunity
How could taxpayer resources be invested more wisely in Baltimore communities?
At an estimated cost of approximately $37,200 per person per year, Maryland taxpayers spend $288 million annually to incarcerate people from Baltimore City. These 7,800 people incarcerated by the state were from 55 communities across the city, but are primarily concentrated in 25 of those communities. Maryland taxpayers spent about $5 million or more to incarcerate people from each of those communities. While Maryland taxpayers continue to pay for prison costs, residents in these communities face substantial challenges, especially related to employment, income, housing and educational attainment, that if addressed, would improve public safety, enhance community well-being, and reduce costs for all Maryland taxpayers.
Baltimore City already has a limited number of resources available to help people get jobs, earn an education, get stable housing, and access treatment. For the cost of sending a single person to prison for a year, Baltimore City could pay for half of a high school teacher’s salary, employment training for seven people, two-bedroom apartments for 30 families for one month, or a GED course for 37 people.
Keeping people and dollars in Baltimore City will build safer, stronger communities and fewer people will come into contact with the justice system in the long-term, thereby saving taxpayers millions of dollars each year. Supports and services should be available to all people in Baltimore City, but they should be particularly accessible to people who are returning to their communities from prison, especially in the high incarceration communities. Summaries of an array of Baltimore-based organizations that provide supports and services to Baltimore residents are available online.
Conclusions and recommendations:
The right investments in Baltimore City
| What could Baltimore City communities buy instead of incarceration? | ||
| Cost per person | Number that could be served for $37,000 | |
|---|---|---|
| Drug Treatment for Adults | $4,494 | 8 people |
| Employment Training | $5,000 | 7 people |
| Housing (per month) | $1,252 | 30 families |
| GED Course | $1,000 | 37 people |
Maryland’s corrections and public safety policy decisions have a concentrated impact on Baltimore City communities. Hundreds of millions of taxpayer dollars are spent incarcerating people from Baltimore City, especially those from a handful of less-resourced communities.
Disproportionate spending on incarceration further weakens and exacerbates challenges in the Baltimore communities that face the most barriers to health and economic stability: Taxpayers spend $10 million or more to incarcerate people from each of five communities —including the highest incarceration community where $17 million is spent on incarceration. Diverting resources to other public investments could alleviate acute challenges and distress and provide a better long-term return on investment for Maryland taxpayers. Residents in Baltimore City’s high incarceration communities in general—and in some of these 25 communities, specifically—experience some of the highest levels of:
- Unemployment;
- Reliance on public assistance;
- High school absence;
- Vacant and abandoned housing;
- Emergency calls for service related to narcotics;
- High school incompletion;
- Elevated blood-lead levels among children.
The residents in the high incarceration communities also experience longer commute times, lower average incomes, and lower life expectancy than residents elsewhere in the city.
Having access for the first time to detailed data on the specific home communities of people incarcerated in Maryland presents a unique opportunity to assess which investments will best serve the needs of Baltimore residents and Maryland taxpayers. Policymakers should consider:
Reducing spending on prisons: Freeing up public resources for more effective, long-term ways to address public safety.
The research documenting the negative impact incarceration has on people highlights how critical it is that public dollars are spent on the most effective ways to enhance public safety. Redirecting some of the hundreds of millions of dollars that are currently spent incarcerating people in Maryland toward policies and programs that strengthen communities would help people succeed and keep communities safer. Maryland state and local policymakers can evaluate practices, programs, and procedures that lead to justice system involvement, and enact policies to ensure that incarceration is a last, not first, response to behavior. Maryland could choose to follow the lead of other states:
- New York State - Reducing sentencing length and investing more in treatment. New York’s Rockefeller Drug Laws are a series of statutes that, at one time, allowed more than 20,000 people to be incarcerated under mandatory minimum sentences for drug offenses. In 2009, New York’s governor and legislature enacted a series of reforms which gave more discretion to judges to determine sentence length and directed more dollars towards drug treatment.25
- Texas - Reducing revocations to stave off prison construction. Texas faced the choice of spending $2 billion on 17,000 prison beds or enacting policies that would reduce the projected prison population. Instead of investing in more prison beds, Texas probation departments received additional funds to implement evidence-based supervision practices and treatment programs to reduce revocations. In 2009, the legislature continued funding this initiative and added new components such as 64 reentry coordinators with the goal of further reducing the number of people who return to prison.26
- California - Voter enacted sentencing reforms that invest savings in education. In November 2014, Californians voted to convert some felony offenses to misdemeanor offenses. People convicted of these offenses in the future will be ineligible for state imprisonment. People currently in prison may petition for resentencing.27 California’s Legislative Analyst’s Office projects that Proposition 47 could save taxpayers “in the high hundreds of millions of dollars annually.” Proposition 47 redirects some of these savings to education.
These states took different paths: One enacted wholesale sentencing reform and invested some of the savings in education (California), one engaged in systemic reforms that reduced the number of people returned to prison due to probation violations (Texas), and another mixed approaches by reducing sentence lengths and ramping up treatment (New York).
These states show that it is possible to enact major policy reforms that free-up dollars and resources to address public safety and human need without relying on incarceration.
As new economic opportunities are realized in Baltimore, policymakers can reduce the negative outcomes seen in high incarceration communities by changing criminal justice policy and prioritizing spending that connects people to meaningful work opportunities, safe and affordable housing, educational opportunities, and treatment and health services.
To facilitate these investments in stronger communities, the online version of this report includes a compendium of Baltimore non-profit organizations and public/private financing innovations that offer local services, and also a listing of current policy initiatives before the Maryland legislature that would promote more sustainable solutions. The Maryland Opportunity Compact, for example, is a public/private financing innovation that redeploys public dollars away from high cost, ineffective services to alternatives that work (you can read more about The Maryland Opportunity Compact and the Public Safety Compact among the online resources).
Do not spend more money on incarceration: Find alternatives to jail expansion.
One way to rein in Maryland’s spending on incarceration is to prevent correctional institution expansion. In December 2013, a legislative taskforce recommended that the state of Maryland spend $533 million to replace the Baltimore City Detention Center with a new, larger jail. There is no question that conditions of confinement should be constitutionally sound and promote rehabilitation. However, there are alternative ways to ensure that public safety is protected and that people will return to appear in court that do not require a $535 million expenditure. To reduce the number of people in jail pretrial, Maryland policymakers could implement recommendations from the Task Force to Study the Laws and Policies Relating to Representation of Indigent Criminal Defendants by the Office of the Public Defender28 concerning pretrial release. Key recommendations include:
- Implement a statewide pretrial system that utilizes a standard, validated pretrial risk screening tool at the “initial hearing” at which the pretrial detention/release decision is made;
- Implement a statewide pretrial system that utilizes risk-and-need-based supervision, that referral, and treatment options in all Maryland counties;
- Implement a shared jail management database system to ensure consistency in data collection across the state.
These kinds of reforms aren’t just good public safety and criminal justice policy overall, but will help alleviate population pressures in the pretrial system, and free-up dollars that could be invested in better long-term solutions in the community.
Develop research capacity to analyze the costs and benefits of policy choices: Opportunities for data and analysis.
This analysis of the cost of incarceration in Baltimore and the needs of the communities that are most impacted is only the first step to unraveling the challenging issues in the city and beyond. Resource redirection away from incarceration and toward community services must be carefully monitored and evaluated to be as effective as possible and ensure responsible use of taxpayer resources. Investment in evaluation research—a modest cost in comparison with the cost of incarceration—would allow policymakers and residents to better understand the most efficient and effective way to meet communities’ needs and improve public safety.
The work of the Baltimore Neighborhood Indicators Alliance, cited heavily throughout this report, is invaluable to helping decision makers connect policy choices in different domains. With the right resources, this kind of data could be used alongside criminal justice-related data to conduct cost-benefit analyses on criminal justice policy. The Washington State Institute for Public Policy, for example, provides legislators with an analysis of criminal and juvenile justice policy that accounts for long\0x2010term costs of policy choices compared to the potential investment of other investments in treatment, workforce development, and education.
To facilitate the knowledge-building process, significant data generated by the “No Representation Without Population of 2010 Act” is available in the appendices. This resource includes data showing the home origins of incarcerated people in Maryland by legislative district and city, among other types of places. Other researchers can used this data to conduct further analysis on the needs and challenges that high incarceration communities face.
About the partners
This report and the attendant maps and graphics are the result of collaboration between two organizations that have a long track record in Maryland criminal justice research and policy work.
The Justice Policy Institute (JPI), a research and policy organization dedicated to ending society’s reliance on incarceration has generated over two dozen reports and documents on Maryland’s correctional challenges.
The Prison Policy Initiative (PPI) produces cutting edge research to expose the broader harm of mass criminalization, and then sparks advocacy campaigns to create a more just society. The Prison Policy Initiative’s research and advocacy launched the national movement against prison gerrymandering that led to the passage of the No Representation Without Population Act, legislation which ultimately allowed the organizations to develop this report.
These two lead research organizations worked collaboratively with other organizations, including the Baltimore Grassroots Criminal Justice Network, the Baltimore Neighborhood Indicators Alliance-Jacob France Institute at the University of Baltimore, as well as policymakers and elected officials to procure and review the data and present the information included in this report.
Acknowledgements
Amanda Petteruti, Aleks Kajstura, Marc Schindler, Peter Wagner, and Jason Ziedenberg authored this report.
The authors would like to acknowledge JPI researchers Natacia Canton, Hope DeLap, Jasper Burroughs, Daniel Landsman, and Kathleen Kelly for their assistance with The Right Investment? Corrections Spending in Baltimore.
The authors would like to thank Dr. Seema D. Iyer and Cheryl Knott of the Baltimore Neighborhood Indicators Alliance-Jacob France Institute (BNIA) at the University of Baltimore for recommendations on how to use BNIA’s data in this report.
The authors are grateful to the members of the Greater Baltimore Grassroots Criminal Justice Network for their insight, technical assistance, and suggestions through the development of this report. JPI and PPI would like to specifically thank Gregory Carpenter of Jericho Reentry and Katie Allston of Marian House.
JPI and PPI would like to thank Bill Cooper, demography consultant, for preparing the data produced by Maryland’s “No Representation Without Population Act” data for us.
JPI and PPI would also like to thank Marie Sennett for her thoughtful suggestions.
The authors would like to acknowledge Marie Roda, communications consultant, for her editorial review of the final draft and summary materials, Julie Holman, design consultant, for her design assistance with the maps and Bob Machuga, design consultant, for the cover.
The Prison Policy Initiative thanks the Open Society Foundation and the Public Welfare Foundation for supporting the organization’s national advocacy to end prison gerrymandering.
This report would not have been possible without the generous support of the Open Society Institute— Baltimore.
Appendix A: Background, Methodology, and Indicators of Lost Opportunity
The story behind the access to the data in this report and the opportunity this new data represents for researchers looking to develop sounder public policies is important on its own.
Prison Gerrymandering in Maryland and its impact on democracy and disparities.
The U.S. Census Bureau counts incarcerated people as residents of the community where prisons are located, not of their home communities. When states use this data for legislative redistricting, it causes “prison gerrymandering,” the practice by which the legislative districts that contain prisons have undue influence because those districts have fewer actual constituents than are counted in the Census. “Prison gerrymandering” impacts the fair representation of community needs and their democratic franchise.
Prior to 2010, Maryland was no different from most other states when it came to “prison gerrymandering.” An analysis the Prison Policy Initiative completed of Maryland’s 2001 districts found, for example, that 18 percent of House of Delegates District 2B (near Hagerstown, where several large prisons are located) was made up of incarcerated people. This meant every four residents of District 2B had almost as much influence as five residents of any other district in the state. In this way, before the law change, legislative districts with prisons had a disproportionate impact in state politics.29
The way the Census counts people in prison has a racially and ethnically disparate impact. In Maryland, a majority of the state’s prison population is African-American, and they are generally incarcerated in predominantly white legislative districts. In 2001 a Prison Policy Initiative analysis of Maryland’s 2001 data found that 90 percent of the 5,628 African-Americans credited to District 2B were actually incarcerated people who lived in other parts of the state.
The “No Representation Without Population Act of 2010”
For more than a decade, a constituency has been building to press the Census Bureau to update its methodology to count imprisoned people in their home community. After the federal government rejected requests to change this policy for the 2010 Census, Maryland was the first of several states to develop and enact creative state-level legislative solutions to correct what they perceived as a flaw in the Census Bureau’s data.
In April 2010, Maryland became the first state in the nation where the legislature enacted law to end the practice of “prison gerrymandering” when it passed HB496/SB400, the “No Representation Without Population Act,” legislation sponsored by Delegate Joseline Pena-Melnyk and Senator Catherine Pugh. The passage of this bill followed an effort led by the Maryland American Civil Liberties Union to end the impact of “prison gerrymandering” in Maryland.
The “No Representation Without Population Act” required Maryland to collect the home addresses of people incarcerated in the state’s correctional facilities, map those addresses, and adjust federal census data so that the state and its localities could use that data for redistricting, counting people incarcerated in state prisons at their home addresses.
The law was affirmed by the U.S. Supreme Court, upholding a lower court’s analysis that “the State’s adjusted data will likewise be more accurate than the information contained in the initial census reports, which does not take prisoners’ community ties into account at all.”30
Methodology
Data showing where the incarcerated people in Maryland are from
The “No Representation Without Population Act” solved the problem of prison gerrymandering in Maryland and had the side benefit of producing a dataset that could allow researchers to look, in detail, at where incarcerated people in Maryland are from.
Prior to this report, there has never been a discussion of the state-wide geographic distribution of the places people incarcerated in Maryland state prisons were from because the data did not exist in a public form until 2011.
The information in this report is based on the adjusted Maryland redistricting data, released by the Maryland Department of Planning31 that contains the state’s entire population with the people incarcerated in state prisons reallocated to their home addresses. The Prison Policy Initiative retained Demographer Bill Cooper to subtract this adjusted data from the original Census Bureau redistricting data (PL94-171) to produce a file that shows the home residences of incarcerated people at the block level, state-wide.32 The Prison Policy Initiative then aggregated this data into each of the geography unit levels used in this report. See the side bar above for a full list.
The maps and tables in this report show the home addresses of people incarcerated in Maryland in 2010. While the maps in this report focus on Baltimore, the data that was analyzed represents a variety of geographic designations, including legislative districts, counties and cities, or communities within these cities.
What are Baltimore City’s Community Statistical Areas?
For the purposes of this report, the 55 “Community Statistical Areas” (CSAs) that together cover Baltimore City were used as the geographical units to represent “communities.” The researchers made this choice for reasons that relate to the ability to analyze the data and represent it in ways to explore the impact of incarceration and other policy choices in Maryland.
The 55 CSAs are a more meaningful representation of Baltimore’s communities than other kinds of geographies (for example, residential neighborhood associations). The CSAs solve a difficult problem for people who study communities: neighborhoods are fluid, and statistical data is often collected in ways that are incompatible with shifting or ill-defined boundaries. For example, the City of Baltimore has over 270 neighborhoods, but the boundaries of those neighborhoods do not necessarily match the Census Bureau’s community boundaries. To address this problem, the Baltimore Data Collaborative and the Baltimore City Department of Planning created the 55 CSAs. These 55 units combine Census Bureau data together in ways that better match Baltimore’s understanding of community boundaries, and are used in social planning.
Measures of Community Well-Being: Baltimore Neighborhood Indicators Alliance
This report was primarily designed to show, for the first time, where incarcerated people in Maryland are from, and how much money taxpayers spend on their incarceration. However, using the 55 CSAs also provides the opportunity to combine incarceration data with other information to give more insight into the communities where most Baltimore residents are from.
The Baltimore Neighborhood Indicators Alliance-Jacob France Institute at the University of Baltimore (known as BNIA-JFI) collects over 150 social indicators about each Community Statistical Area, publishes this information online, and works with community organizations and government to use this information to improve policy in Baltimore. This report uses only 12 of the 150 available indicators.33
By adding social indicators from BNIA this report shows that the communities that have many people in prison are facing other challenges. Knowing how communities fair on indicators of community well-being in the places where taxpayers spend the most money on incarceration can help policymakers make better choices.34 This information can help focus policymakers on the kind of investments they can make to help improve public safety, and reduce the likelihood a person will become involved in the justice system.
The resulting analysis suggests that by continuing to send so many people from Baltimore to prison, Maryland is missing opportunities to direct public investments toward challenged communities that are falling behind other parts of Baltimore.
Estimates of the number of people in jail from Baltimore communities
This report does not include an in-depth discussion of people incarcerated in local jails or federal prisons, because that data was not available.35 Because there is a current and pressing policy debate over how taxpayer dollars are used for pretrial jail detention in Baltimore, this report offers an estimate in Appendix B of how many people in Baltimore communities might be incarcerated in the Baltimore City Detention Center.
Estimates of the cost of incarceration in Maryland
Nationally, more than $82 billion36 is spent on corrections each year, and with policy debates focused on how public resources should be spent to develop the most effective public safety policies, how the cost of incarceration is projected is a critical and controversial issue.
The cost of incarcerating a single person from a community was estimated by multiplying a figure ($37,200) provided by the Department of Legislative Services and used in the 2014 Maryland legislative session in their Fiscal and Policy notes on legislative initiatives that might affect corrections. The Department of Legislative Services notes, “persons serving a sentencing longer than 18 months are incarcerated in State correctional facilities. Currently, the average total cost per inmate, including overhead, is estimated to be $3,100 a month.” Each legislative session, the Department of Legislative Services receives these monthly costs directly from the Maryland Department of Public Safety and Correctional Services.
Along with the total monthly expenditure that includes overhead, the Department of Legislative Services also includes separate estimates that exclude overhead ($735 per month) and health care ($185 per month).37 These additional figures are provided to legislators based on the assumption that a change in policy that affects the incarceration of a few people—such as a change in sentencing that reduces incarceration in such a small way that a facility is not likely to close—would save less money than more significant, wholesale reform.
The annualized average cost per person including overhead and health care—rounded down to the nearest thousand—is used in this report because the findings speak to a need for wholesale sentencing and corrections reform. Such reform would lead to the closure of prisons and to the kind of cost savings that allow for a significant redirection of funds to address some of the most pressing challenges in Baltimore’s high incarceration communities. Rather than be limited by marginal changes to the system, this report portrays the data in a way that wholesale reform should be considered.
In addition, the annual total cost of incarcerating a person in 2014 used in this report is within the range of recently published figures by the Vera Institute of Justice and the former Secretary of the Department of Public Safety and Correctional Services.38
Indicators of Lost Opportunity
Unemployment and Commute Time
Employment is critical to helping people succeed and build strong, safe communities.39 Overall, employment in Baltimore City continues to lag behind the rest of the state of Maryland (average 5.9 percent in 2014),40 even though it has fallen from a recent average high of 11.8 percent in 2010 to 8.7 percent in 2014.41 African Americans and Latinos are more likely to be unemployed than whites. In 2012, the unemployment rate for whites in Maryland was 5.6 percent, while for African Americans it was almost twice as high at 10.2 percent.42
A long commute time is a manifestation of the lack of opportunity in a particular community and the challenges that an individual may have accessing jobs. According to the Baltimore Regional Talent Development Pipeline Study, 85 percent of all new jobs that will be created between 2012 and 2020 will be outside of Baltimore City43 in regions that are not easily accessible by public transportation. The failure to develop job opportunities in all of Baltimore’s communities will result in an increase in travel times for more people and increase the barriers to getting and keeping employment while preserving a role in family and community life.
The percent of population aged 16-64 not employed44 and percent of the employed population with travel time to work of 45 minutes or more are two indicators used to explore the dimensions of employment challenges among those places that taxpayers spend the most money to incarcerate people from a community.
Income and Public Assistance
Simply having a job is not enough; a person must be able to earn enough money to support a family. This is a particular challenge in cities where any economic growth coincides with an increase in the cost of basic expenses like housing, transportation, and other living expenses. In particular, new residents with higher incomes have moved in and changed the landscape of the Inner Harbor and Downtown, while communities only a short distance away continue to struggle with unemployment and low wages.
Public support can provide income where the economy fails to produce enough good jobs, but ideally families will have access to employment with adequate wages. Research has shown little evidence that people who receive TANF are encouraged to progress in their careers, often placed in jobs with few, if any opportunities, to also participate in job training or educational opportunities that would lead to promotion.45
Median household income and the percent of families receiving TANF are two indicators used to show the challenges that high incarceration communities face in generating and sustaining the income levels needed to support a strong, healthy community.
Educational Attainment
Education has a variety of benefits related to health, civic engagement, and social engagement,46 but perhaps most importantly, educational attainment is the foundation for access to well-paying employment. For people returning to the community from prison, education and job training is particularly important: nationally, about two-thirds of people in prison do not have a high school diploma.47 Education is increasingly important in the job market. In Baltimore City, over half of the new jobs that will be created between 2012 and 2020 will require more than a high school diploma.48 In addition, the jobs that don’t require at least some college pay less than a living wage.49 Job training also seems out of reach to the one-third of Baltimore area job seekers who report that they are unable to afford even professional clothes or work boots.50
The indicators, percent of the population 25 years and over with less than a high school diploma or GED and percent of 9th to 12th grade students that are chronically absent, are the two indicators indicative of the high incarceration communities’ challenges related to educational attainment.
Addiction
Challenges with drugs can impede a person’s ability to succeed, as well as negatively impact a whole community. Research shows that substance abuse can interfere with a person’s ability to get and keep a job, maintain housing, get an education, and stay out of prison.51 For people coming out of prison who are from Baltimore, these challenges are particularly salient: the justice system alone accounts for 30 percent of admissions to treatment.52 The availability of treatment outside of the criminal justice system is not only important for keeping people from becoming involved in the justice system from the outset, but also for ensuring that people returning to the community from prison do not return to the system.53 Addiction and access to treatment outside the justice system has played a role in Maryland’s prison reform challenges.54
The availability of help in drug-related emergencies is an important public health service in Baltimore City. If there is a drug problem in their community that warrants it, people should make an emergency call. In the absence of data about the number of people in need of treatment in Baltimore City across communities, this report uses the number of narcotics calls for service per 1,000 resident as a proxy indicator for the drug treatment challenge facing these Baltimore communities.
Physical Health
Good physical health is critical to holding a job or attending school regularly.55 Coupled with other logistical barriers to work, like a long commute time, for example, someone with a health condition is unlikely to be able to work. The Urban Institute reports work-limiting physical and behavioral health as the second most cited barrier to work after lack of education.56
Because people who have a shorter lifespan are less likely to be in good health, this report uses mortality for young people ages 15-24 and average life expectancy as indicators of good health. Combined with incarceration and cost data, it is possible to see how high incarceration communities fair in supporting the good health of their residents.
Housing
Stable, quality housing supports a variety of other activities, such as working, going to school, and maintaining good health. But housing is out of reach for many residents of Baltimore communities, which relates to the income level, job opportunities, and educational attainment of the residents. In Baltimore City in December 2014, average monthly rents for a one-bedroom apartment were $1,024, amounting to a yearly total of $12,288,57 but the median income in some communities in Baltimore is as low as $13,500.
Baltimore City anticipates continued economic development that will add housing stock to some parts of the City, while others will continue to struggle with vacant or abandoned houses and dilapidated housing. The presence of empty and abandoned houses has been found to be correlated with feelings of community disassociation. Communities that are the least cohesive tend to have higher levels of incarceration and lower levels of employment and education.58
Quality housing is just as important as availability of housing. Lead is often found in lower-quality, deteriorating housing59 and has been found to affect a child’s brain development, negatively impacting the ability to learn and interact with others.60 Elevated blood-lead levels have been found to be correlated with involvement in the justice system, and can have serious and long-term consequences for young people throughout their lifetime.61
Percentage of residential properties that are vacant and abandoned and percent of children age 0-6 with elevated blood-lead levels are indicators of unavailable or poor-quality housing used to show the challenge that high incarceration communities face housing their residents.
Public safety
Many factors influence crime rates. One factor is related to the sense that community members trust one another and have a sense of unity, both of which are formed over long periods of time. Neighborhoods in which many people move or are removed—sent to prison, for example—struggle to form the bonds that have a way of insulating a community from crime.62 In addition, removing people from their communities and sending them to prison further erodes public safety by creating a population of “custodial citizens” who are not invested in their communities because they believe the government does not care about them.63 Incarceration fuels a cycle of feelings of neglect, community disassociation, and crime. As Vesla Weaver, professor at Yale University observes in a recent opinion in the Baltimore Sun: “The expansion of criminal justice into the neighborhoods of our fellow citizens here in Baltimore and elsewhere is not just an expensive way to deal with crime. It destabilizes communities socially and economically.”64
Research in Maryland and Baltimore City confirms these findings, showing that the communities that saw the highest rates of justice involvement continued to see high rates of violent crime65 —an indicator that simply locking more people up does not necessarily make a community safer.
To provide additional context related to the safety and well-being of high incarceration communities, the report includes the indicator, violent crime rates per 1,000 residents.
Limitations related to social indicators
The indicators included here suggest that the same communities that have the most people in prison also struggle with employment, education, addiction, housing, health, and public safety.
Overall, these associations appear to grow stronger as the number of people in prison in a community increases. Ten out of 12 indicators in this analysis worsened as the number of people in prison increased in the 25 high incarceration communities, the 5 “higher” incarceration communities, and the “highest” incarceration community.66
The data presented in the following maps and tables represents a first step towards concretely understanding what is happening in high incarceration communities, and what may, or may not be the implications of correctional investment on social policy. However, this analysis included no tests of significance, therefore any associations between the indicators mentioned in this report cannot be considered statistically significant or any evidence of causation.
Nonetheless, the challenges that Baltimore City communities face increases in intensity the more people that are in prison. Even without sophisticated statistical analyses, it is apparent that incarceration is doing little to improve community well-being. Maryland taxpayers, policymakers, and stakeholders would do well to reassess spending priorities so that any community in Baltimore City, or otherwise, has the resources and opportunities it needs to help residents get and keep jobs, earn enough for a sustainable life, succeed in school, stay healthy, and stay safe.
Footnotes
Maryland Department of Public Safety and Correctional Services, p.21, Secretary’s End of Year Report FY2010 (Towson, MD: Maryland Department of Public Safety and Correctional Services, 2010). www.dpscs.state.md.us/publicinfo/publications/pdfs/2010_DPSCS_End_of_Year_Report.pdf ↩
See Appendix B for an explanation of Baltimore’s 55 Community Statistical Areas. ↩
The estimated total cost of incarceration for 25 Community Statistical Areas in Baltimore City is $288 million. Calculated using an estimate from the Maryland Department of Legislative Services indicating that it costs $37,200 per year to incarcerate one person. An underestimate of $37,000 is used for the purpose of this report. See Appendix B for a longer discussion of the estimated cost of incarceration in Maryland. Maryland Department of Legislative Services, Maryland General Assembly, 2014 Session, HB 104 Fiscal and Social Policy Note: Contraband-Places of Confinement-Penalty, http://mgaleg.maryland.gov/2014rs/fnotes/bil_0004/hb0084.pdf ↩
The Pew Charitable Trusts, “Prison and Crime: A Complex Link,” September 2014. www.pewtrusts.org/en/multimedia/data-visualizations/2014/prison-and-crime ↩
For example, there are ongoing discussions about building a new, larger jail in Baltimore, which has included a budgetary line item. (See Department of Legislative Services, Special Joint Commission on Public Safety and Security in State and Local Correctional Facilities, (Annapolis, MD: Maryland Office of Policy Analysis, December 2013). www.wbaltv.com/blob/view/-/23438840/data/1/-/rns7skz/-/Jail-complex-legislative-recommendations.pdf ↩
Patrick Starkey, Stuck in Place: Urban Neighborhoods and the End of Progress Toward Racial Equality (Chicago: University of Chicago Press, 2013). ↩
Elizabeth Kneebone, The Growth and Spread of Concentrated Poverty, 2000 to 2008-2012 (Washington, DC: Brookings Institute, 2014). www.brookings.edu/research/interactives/2014/concentrated-poverty#/M12580 ↩
Don Stemen, Reconsidering Incarceration: New Directions for Reducing Crime (New York, NY: Vera Institute of Justice, January 2007). www.vera.org/sites/default/files/resources/downloads/veraincarc_vFW2.pdf ↩
Maryland Department of Labor, Licensing and Regulation, “Civilian Labor Force, Employment & Unemployment by Place of Residence (LAUS) - Maryland,” December 19, 2014, accessed January 20, 2015. http://www.dllr.state.md.us/lmi/laus/maryland.shtml ↩
Maryland Department of Labor, Licensing and Regulation, “Civilian Labor Force, Employment & Unemployment by Place of Residence (LAUS) - Maryland,” December 19, 2014, accessed January 20, 2015. http://www.dllr.state.md.us/lmi/laus/maryland.shtml ↩
This indicator was calculated using the BNIA indicator “Percent population 16-64 employed (2008-2012). This indicator is intended to capture all people who are not working regardless of circumstance or choice. ↩
Organisation for Economic Cooperation and Development, Education Indicators in Focus (Paris, France: Organisation for Economic Cooperation and Development, January 2013). https://www.oecd.org/education/skills-beyond-school/EDIF%202013--N%C2%B010%20(eng)--v9%20FINAL%20bis.pdf ↩
Caroline Wolf Harlow, Education and Correctional Populations (Washington, DC: U.S. Department of Justice, Bureau of Justice Statistics, January 2003). www.bjs.gov/content/pub/ascii/ecp.txt ↩
Beth M. Huebner, Drug Abuse, Treatment, and Probationer Recidivism, (Chicago, IL: Illinois Criminal Justice Information Authority), 8; Hunger and Homelessness Survey, (Washington, DC: U.S. Conference of Mayors, 2008), http://usmayors.org/pressreleases/documents/hungerhomelessnessreport_121208.pdf, 19; Substance Abuse among 12th Grade Aged Youths and Drop Out Status, (Washington, DC: Substance Abuse and Mental Health Services Administration, 2013) , http://archive.samhsa.gov/data/2k13/NSDUH036/SR036SubstanceUseDropouts.htm, 1; National Council on Alcoholism and Drug Dependence, “Drugs and the Workplace,” https://ncadd.org/learn-about-drugs/workplace. ↩
Rebecca Mitchell and Paul Bates, “Measuring Health-Related Productivity Loss,” Population Health Management 14, no. 2 (2011): 93-98. ↩
Dan Bloom, Pamela Loprest, and Sheila Zedlewski, TANF Recipients with Barriers to Employment (Washington, DC: Urban Institute, August 2011). https://www.urban.org/sites/default/files/publication/25396/412567-TANF-Recipients-with-Barriers-to-Employment.PDF ↩
Elaine Wedlock, Crime and Cohesive Communities, (London, UK: The Home Office, 2006), 2. ↩
U.S. Environmental Protection Agency. Undated. Lead Awareness Program. www.epa.gov/lead/, accessed August 22, 2007. ↩
Mueller, Elizabeth J., and J. Rosie Tighe. 2007. Making the case for affordable housing: Connecting housing with health and education outcomes. Journal of Planning Literature 21(4). ↩
Keith Harries, “Violence Change and Cohort Trajectories: Baltimore Neighborhoods, 1990-2000” Urban Geography. Vol. 25, p. 16. 2004. ↩
The only two indicators which did not increase from the five “higher” to the “highest” incarceration community were Mortality by Age 15-24 years old and Life Expectancy. Please see the table on page 12, “As the number of people in prison increases, on average, indicators of community well-being worsen.” ↩
Three of these communities, Edmondson Village ($4,958,000), Greater Charles Village/Barclay, ($4,810,000), and Brooklyn/Curtis Bay/Hawkins Point ($4,773,000) each account for “about” $5 million in corrections spending. ↩
The five higher incarceration communities ranked 5th through 9th for highest unemployment in Baltimore City. ↩
The five higher incarceration communities had the 6th to the 10th lowest incomes in Baltimore City. ↩
Drug Policy in New York: From the Rockefeller Drug Laws to a Health and Public Safety Approach Explaining the 2009 Reforms, December, 2009. www.drugpolicy.org/docUploads/ndny_rdlreforms.pdf ↩
Right-on-Crime, “Right-on-Crime: State Initiatives—Texas.” www.rightoncrime.com/reform-in-action/state-initiatives/texas/ ↩
California Legislative Analysts Office, Initiative Statute (November 2014),www.lao.ca.gov/ballot/2014/prop-47-110414.aspx ↩
Department of Legislative Services, Task Force to Study the Laws and Policies Relating to Representation of Indigent Criminal Defendants by the Office of the Public Defender - Final Report (Annapolis, MD: Maryland Office of Policy Analysis, December 13, 2013), pgs. 6-7. https://msa.maryland.gov/megafile/msa/speccol/sc5300/sc5339/000113/018000/018924/unrestricted/20140000e.pdf ↩
People in prison remain residents of their home districts, but at redistricting time, they are assigned to the district where they are incarcerated. This skewed population assignment means that the more people in prison that are counted in a district, the fewer actual constituents the prison district legislator has, but is still allowed a full vote in the General Assembly. Therefore, people who live near prisons each get a stronger say in state government than people who live in a district without any of these “phantom constituents.” For more information about prison gerrymandering in Maryland see Importing Constituents at www.prisonersofthecensus.org/md/report.html ↩
Fletcher v. Lamone, 831 F.Supp.2d 887, 897 (2011), aff’d 567 U.S. __, (June 25, 2012, No. 11-1178) ↩
http://planning.maryland.gov/redistricting/2010/dataDownload.shtml ↩
The reallocated population was 16,986, a figure smaller than the 22,087 figure for the total Maryland Department of Public Safety and Correctional Services. This discrepancy exists because 1,321 residents of other states were not reallocated to addresses outside the prison, and some other individuals had addresses that could not be found within the state. The slight discrepancy between the totals of some of our tables in the appendix is the result of minor incompatibilities between the geography files that we used, for example, the county maps do not precisely align with some other maps in a way that introduces the geographic equivalent of a very minor rounding error. ↩
For the purposes of getting a full picture of the number of people of working age who are not working regardless of ability to work, this report uses the inverse of the indicator “Percent of the Population 16-64 employed” (2008-2012). ↩
In the brief, the author shows that investments in education, employment and housing can have a public safety impact. Don Stemen, Reconsidering Incarceration: New Directions for Reducing Crime (New York, NY: Vera Institute of Justice, January 2007). www.vera.org/sites/default/files/resources/downloads/veraincarc_vFW2.pdf ↩
In the Appendix, the authors also provide an estimate of how many people from each Community Statistical Area are incarcerated in the Baltimore City Detention Center. (This is the same facility sometimes referred to as the Baltimore City Jail.) This estimate is based on the assumption that the jail population is distributed proportionally to the prison population, and we encourage future researchers to test that assumption and explore the reasons for any differences. We simply calculated the ratio between the number of people in state prisons the No Representation Without Population Act credited back to the city of Baltimore (7,795) to the total population of the Baltimore jail (3,595) on the same April 2010 date.This ratio of 0.46 was applied to each Community Statistical Area and then the number rounded to the nearest whole number. ↩
See Leah Sakala, Paying the price of mass incarceration, Prison Policy Initiative at www.prisonpolicy.org/blog/2014/05/23/price-of-incarceration/ ↩
To review the three different variations of costs used by the Department of Legislative Services in their analysis of House and Senate bills, see: Department of Legislative Services, Maryland General Assembly, 2014 Session, HB 104 Fiscal and Social Policy Note: Contraband-Places of Confinement-Penalty, http://mgaleg.maryland.gov/2014rs/fnotes/bil_0004/hb0084.pdf or Department of Legislative Services, Maryland General Assembly, 2014 Session, SB 113 Fiscal and Policy Note: Criminal Law - Contraband - Telecommunication Devices - Penalty, http://mgaleg.maryland.gov/2014RS/fnotes/bil_0003/sb0113.pdf. The authors note that in 2012, in the Vera Institute of Justice report “The Price of Prisons: What Incarceration Costs Taxpayers, the organization estimated that it cost taxpayers $38,383 in 2010 as the average cost per incarcerated person, and that in a former Secretary Gary D. Maynard of the Department of Public Safety and Correctional Services said in 2012 that the average cost of incarceration per person was $32,000. Both these figures place the cost estimate used by the researchers well within an acceptable range.See: www.dpscs.state.md.us/publicinfo/features/Reentry/md_reentry-ppt.pdf. ↩
Christian Henrichson and Ruth Delaney, The Price of Prisons: What Incarceration Costs Taxpayers (New York, NY: Vera Institute, 2012). www.vera.org/files/price-of-prisons-maryland-fact-sheet.pdf. ↩
Don Stemen, Reconsidering Incarceration: New Directions for Reducing Crime (New York, NY: Vera Institute of Justice, January 2007). www.vera.org/sites/default/files/resources/downloads/veraincarc_vFW2.pdf ↩
Maryland Department of Labor, Licensing and Regulation, “Civilian Labor Force, Employment & Unemployment by Place of Residence (LAUS) - Maryland,”December 19, 2014, accessed January 20, 2015. http://www.dllr.state.md.us/lmi/laus/maryland.shtml ↩
Maryland Department of Labor, Licensing and Regulation, “Civilian Labor Force, Employment & Unemployment by Place of Residence (LAUS) - Baltimore City,” December 26, 2014, accessed January 20, 2015. www.dllr.state.md.us/lmi/laus/baltimorecity.shtml ↩
Sean Miskell, Benjamin Orr, Debra Okeke, and Matthew Weinstein, State of Working Maryland, 2013 (Silver Spring: MD, Progressive Maryland, February 2014), pg. 2 http://www.mdeconomy.org/wp-content/uploads/2014/03/MDCEP_StateWorkMD_2013.pdf ↩
RDA Global, Inc, Barriers to Employment Opportunities in the Baltimore Region (Baltimore, MD: Opportunity Collaborative, June 2014), pg. 16. http://baltometro.org/phocadownload/Publications/OpportunityCollaborative/170508_Barriers_to_Employment_Opportunity_in_the_Baltimore_Region-June_2014.pdf ↩
This indicator was calculated using the BNIA indicator “Percent population 16-64 employed (2008-2012). This indicator is intended to capture all people who are not working regardless of circumstance or choice. ↩
Elizabeth Lower-Basch and Mark Greenberg, “Single Mothers in the Era of Welfare Reform,” in The Gloves-off Economy: Workplace Standards at the Bottom of America’s Labor Market (Champaign IL: Labor and Employment Relations Association, 2008), 163-190. Available at: https://www.clasp.org/publications/journal-article/single-mothers-era-welfare-reform ↩
Organisation for Economic Cooperation and Development, Education Indicators in Focus (Paris, France: Organisation for Economic Cooperation and Development, January 2013). https://www.oecd.org/education/skills-beyond-school/EDIF%202013--N%C2%B010%20(eng)--v9%20FINAL%20bis.pdf ↩
Caroline Wolf Harlow, Education and Correctional Populations (Washington, DC: U.S. Department of Justice, Bureau of Justice Statistics, January 2003). www.bjs.gov/content/pub/ascii/ecp.txt ↩
RDA Global, Inc, Barriers to Employment Opportunities in the Baltimore Region (Baltimore, MD: Opportunity Collaborative, June 2014), pg. 7. http://baltometro.org/phocadownload/Publications/OpportunityCollaborative/170508_Barriers_to_Employment_Opportunity_in_the_Baltimore_Region-June_2014.pdf ↩
RDA Global, Inc, Baltimore Regional Talent Development Pipeline Study (Baltimore, MD: Opportunity Collaborative, October 2013). ↩
RDA Global, Inc, Barriers to Employment Opportunities in the Baltimore Region (Baltimore, MD: Opportunity Collaborative, June 2014). http://baltometro.org/phocadownload/Publications/OpportunityCollaborative/170508_Barriers_to_Employment_Opportunity_in_the_Baltimore_Region-June_2014.pdf ↩
Beth M. Huebner, Drug Abuse, Treatment, and Probationer Recidivism,(Chicago, IL: Illinois Criminal Justice Information Authority), 8; Hunger and Homelessness Survey, (Washington, DC: U.S. Conference of Mayors, 2008), http://usmayors.org/pressreleases/documents/hungerhomelessnessreport_121208.pdf, 19; Substance Abuse among 12th Grade Aged Youths and Drop Out Status, (Washington, DC: Substance Abuse and Mental Health Services Administration, 2013), http://archive.samhsa.gov/data/2k13/NSDUH036/SR036SubstanceUseDropouts.htm, 1; National Council on Alcoholism and Drug Dependence, “Drugs and the Workplace,” https://ncadd.org/learn-about-drugs/workplace. ↩
Greg Warren, Outlooks and Outcomes FY 2011 (Baltimore, MD: Baltimore Substance Abuse Systems, Inc., 2012). http://www.bhsbaltimore.org/site/wp-content/uploads/2012/06/BSAS-Outlook-and-Outcomes-FY2011-07-16-2012-revision2.pdf ↩
Laurie Robinson and Jeremy Travis, “Managing Prisoner Reentry for Public Safety,” Federal Sentencing Reporter 12, no. 5 (2000): 258-265. ↩
Doug McVay, Vincent Shiraldi, and Jason Ziedenberg, Treatment or Incarceration: National and State Findings on the Efficacy and Cost Savings of Drug Treatment Versus Imprisonment, (Washington, DC: Justice Policy Institute, 2004), pg. 3. www.justicepolicy.org/uploads/justicepolicy/documents/04-01_rep_mdtreatmentorincarceration_ac-dp.pdf ↩
Rebecca Mitchell and Paul Bates, “Measuring Health-Related Productivity Loss,” Population Health Management 14, no. 2 (2011): 93-98. ↩
Dan Bloom, Pamela Loprest, and Sheila Zedlewski, TANF Recipients with Barriers to Employment (Washington, DC: Urban Institute, August 2011). https://www.urban.org/sites/default/files/publication/25396/412567-TANF-Recipients-with-Barriers-to-Employment.PDF ↩
RentJungle.com, “Rent trend data in Baltimore, Maryland,” accessed January 13, 2015. Average rent totaled by multiplying the average rent of $1,024 by 12 to get a yearly figure. ↩
Elaine Wedlock, Crime and Cohesive Communities, (London, UK: The Home Office, 2006), 2. ↩
U.S. Environmental Protection Agency. Undated. Lead Awareness Program. www.epa.gov/lead/, accessed August 22, 2007. ↩
Mueller, Elizabeth J., and J. Rosie Tighe. 2007. Making the case for affordable housing: Connecting housing with health and education outcomes. Journal of Planning Literature 21(4). ↩
Nevin, Rick. 2000. How lead exposure relates to temporal changes in IQ, violent crime, and unwed pregnancy. Environmental Research 83(1). ↩
Robert J. Sampson, Stephen W. Raudenbush, and Felton Earls. “Neighborhoods and Violent Crime: A Multilevel Study of Collective Efficacy”. Science. 277 (15), p. 918-924. Aug. 1997. http://www.d.umn.edu/~jmaahs/MA%20Theory%20Articles/Sampson%20et%20al%20collective%20efficacy.pdf ↩
Amy E. Lerman and Vesla M. Weaver, Arresting Citizenship: The Democratic Consequences of American Crime Control (Chicago, IL: University of Chicago Press, 2014). ↩
Vesla Weaver, “High Incarceration may be more harmful than high crime,” Baltimore Sun, December 21, 2014. www.baltimoresun.com/news/opinion/oped/bs-ed-incarceration-rates-20141221-story.html ↩
Keith Harries, “Violence Change and Cohort Trajectories: Baltimore Neighborhoods, 1990-2000”. Urban Geography. Vol. 25, p. 16. 2004. ↩
The only two indicators which did not increase from the five “higher” to the “highest” incarceration community were Mortality by Age 15-24 years old and Life Expectancy. Please see the table on page 12, “As the number of people in prison increases, on average, indicators of community well-being worsen.” ↩
Recommended Reading:

The unmet health needs of people in prison
States fall far short of their duty to meet the health needs of incarcerated people.

All profit, no risk
The bail industry exploits cracks and loopholes in the legal system to avoid accountability, while growing its profits.

Compare your state's use of the prison to the world at large
Criminal justice policy in every region of the United States is out of step with the rest of the world.

Prison Gerrymandering Project
We are leading the movement to protect our democracy from the Census Bureau's prison miscount.