Section II: Incarceration & Its Consequences
America's Prisoners
Who is in prison?
- Percent of state prisoners in 1997 that are male315: 93.7%
- Percent of state prisoners in 1997 that are at least 55 years old316: 3.1%
- Percent of state prisoners in 1997 that have no more than an 8th grade education317: 14.2%
- Percent of state prisoners in 1997 that do not have a high school diploma or GED318: 43.1%
- Percent of state prisoners in 1997 who are serving their first sentence319: 19.3%
What crimes did they commit?
- Percent of state prisoners in 1997 incarcerated for a violent offense320: 46.6%
- Percent of state prisoners in 1997 incarcerated for murder321: 11.7%
- Percent of state prisoners in 1997 incarcerated for a property offense322: 22.0%
- Percent of state prisoners in 1991 incarcerated for a drug offense323: 21.3%
- Percent of state prisoners in 1997 incarcerated for a drug offense324: 57.9%
- Percent of federal prisoners in 1997 incarcerated for a violent offense325: 14.8%
- Percent of federal prisoners in 1997 incarcerated for murder326: 1.5%
- Percent of federal prisoners in 1997 incarcerated for a property offense327: 22.0%
- Percent of federal prisoners in 1991 incarcerated for a drug offense328: 20.7%
- Percent of federal prisoners in 1997 incarcerated for a drug offense329: 62.6%
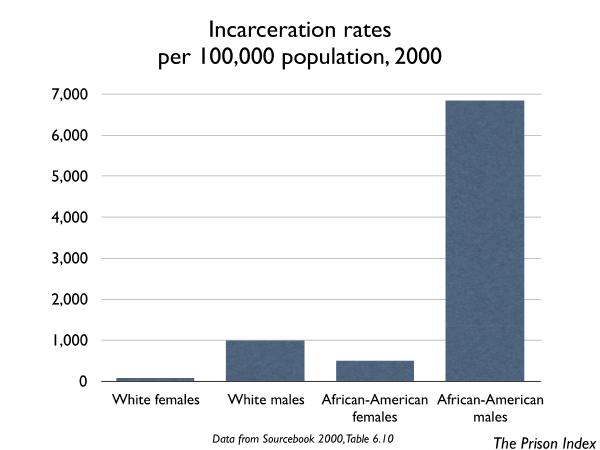
Who gets sent to prison?
- Number of White male prisoners per 100,000 U.S. males, 2000330: 990
- Number of White female prisoners per 100,000 U.S. females, 2000331: 76
- Number of African-American male prisoners per 100,000 U.S. males, 2000332: 6,838
- Number of African-American female prisoners per 100,000 U.S. females, 2000333: 491
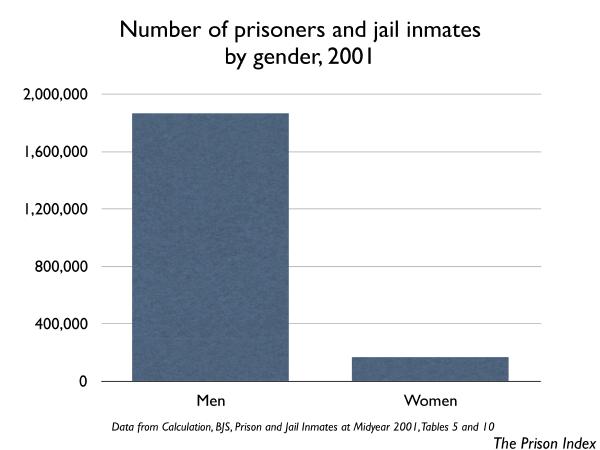
- Number of women prisoners in state prisons, 1990334: 39,054
- Number of women prisoners in state prisons, 2000335: 81,367
- Number of women prisoners in federal prisons, 1990336: 5,011
- Number of women prisoners in federal prisons, 2000337: 10,245
Race
- Percentage of U.S. population that is African-American, 2000338: 12.3%
- Percentage of adults in state prison who are African-American, 1997339: 45.6%
- Percentage of U.S. population that is White 2000340: 75.1%
- Percentage of adults in state prison who are White, 1997341: 33.3%
- Percentage of U.S. population that is Hispanic or Latino, 2000342: 11.8%
- Percentage of adults in state prison who are Hispanic, 1997343: 17.0%
- Number of times an African-American was more likely to be sent to prison than a White person in 1930344: 2.9
- Number of times an African-American was more likely to be sent to prison than a White person in 1986345: 5.4
- Percent of Montana that is Native American346: 7%
- Percent of Montana State Prison at Deer Lodge that is Native American347: 17%
- Percent of women incarcerated at the Montana State Prison in Billings that are Native American348: 40%
This page is an excerpt from The Prison Index: Taking the Pulse of the Crime Control Industry (April 2003) by Peter Wagner, published by the Western Prison Project and the Prison Policy Initiative.
Footnotes
315 Bureau of Justice Statistics, Sourcebook of Criminal Justice Statistics, 2000, Table 6.38.
316 Bureau of Justice Statistics, Sourcebook of Criminal Justice Statistics, 2000, Table 6.38.
317 Bureau of Justice Statistics, Sourcebook of Criminal Justice Statistics, 2000, Table 6.38.
318 Calculation based on Bureau of Justice Statistics, Sourcebook of Criminal Justice Statistics, 2000, Table 6.38.
319 Bureau of Justice Statistics, Sourcebook of Criminal Justice Statistics, 2000, Table 6.40.
320 Bureau of Justice Statistics, Sourcebook of Criminal Justice Statistics, 2000, Table 6.39.
321 Bureau of Justice Statistics, Sourcebook of Criminal Justice Statistics, 2000, Table 6.39.
322 Bureau of Justice Statistics, Sourcebook of Criminal Justice Statistics, 2000, Table 6.39.
323 Bureau of Justice Statistics, Sourcebook of Criminal Justice Statistics, 2000, Table 6.39.
324 Bureau of Justice Statistics, Sourcebook of Criminal Justice Statistics, 2000, Table 6.39.
325 Bureau of Justice Statistics, Sourcebook of Criminal Justice Statistics, 2000, Table 6.39.
326 Bureau of Justice Statistics, Sourcebook of Criminal Justice Statistics, 2000, Table 6.39.
327 Bureau of Justice Statistics, Sourcebook of Criminal Justice Statistics, 2000, Table 6.39.
328 Bureau of Justice Statistics, Sourcebook of Criminal Justice Statistics, 2000, Table 6.39.
329 Bureau of Justice Statistics, Sourcebook of Criminal Justice Statistics, 2000, Table 6.39.
330 Bureau of Justice Statistics, Sourcebook of Criminal Justice Statistics, 2000, Table 6.10.
331 Bureau of Justice Statistics, Sourcebook of Criminal Justice Statistics, 2000, Table 6.10.
332 Bureau of Justice Statistics, Sourcebook of Criminal Justice Statistics, 2000, Table 6.10.
333 Bureau of Justice Statistics, Sourcebook of Criminal Justice Statistics, 2000, Table 6.10.
334 Bureau of Justice Statistics, Sourcebook of Criminal Justice Statistics, 2000, Table 6.41.
335 Bureau of Justice Statistics, Sourcebook of Criminal Justice Statistics, 2000, Table 6.41.
336 Bureau of Justice Statistics, Sourcebook of Criminal Justice Statistics, 2000, Table 6.41.
337 Bureau of Justice Statistics, Sourcebook of Criminal Justice Statistics, 2000, Table 6.41.
338 Census 2000, Table QT-P3.
339 Bureau of Justice Statistics, Sourcebook of Criminal Justice Statistics, 2000, Table 6.38
340 Census 2000, Table QT-P3.
341 Bureau of Justice Statistics, Sourcebook of Criminal Justice Statistics, 2000, Table 6.38
342 Census 2000, Table QT-P3.
343 Bureau of Justice Statistics, Sourcebook of Criminal Justice Statistics, 2000, Table 6.38
344 Calculation, Peter Wagner, Prisoner disenfranchisement and state legislative redistricting in New York State: Electoral appropriation and the return of the 3/5ths clause, unpublished manuscript, November 2001, Table 1.
345 Calculation, Peter Wagner, Prisoner disenfranchisement and state legislative redistricting in New York State: Electoral appropriation and the return of the 3/5ths clause, unpublished manuscript, November 2001, Table 1.
346 Kathleen McLaughlin, Prison System to Focus on Indian Issues, The MontanaStandard, May 11, 2001.
347 Kathleen McLaughlin, Prison System to Focus on Indian Issues, The Montana Standard, May 11, 2001.
348 Kathleen McLaughlin, Prison System to Focus on Indian Issues, The Montana Standard, May 11, 2001.
Recommended Reading:

Advocacy Toolkit
Resources, tips, and best practices to help advocates working to end mass incarceration.

50 state incarceration profiles
All of our recent reports about prison/jail growth, racial disparities, and more, re-organized by state.

Mass Incarceration: The Whole Pie
The U.S. incarcerates nearly 2 million people. Where are they locked up and why? Read our report.

Events
- July 1, 2026:
On July 1, 2026 at 1 p.m. EST, join the Prison Policy Initiative and guests Jodi Hocking, Executive Director of Return Strong Nevada, and Taj Mahon-Haft PhD, Director of The Humanization Project, as they discuss the importance of family connections, highlight the ways they are under attack, and share strategies to help families fight back.
Register here
Not near you?
Invite us to your city, college or organization.