Can you help us sustain this work?
Thank you,
Peter Wagner, Executive Director Donate
Section II: Incarceration & Its Consequences
Behind the Walls
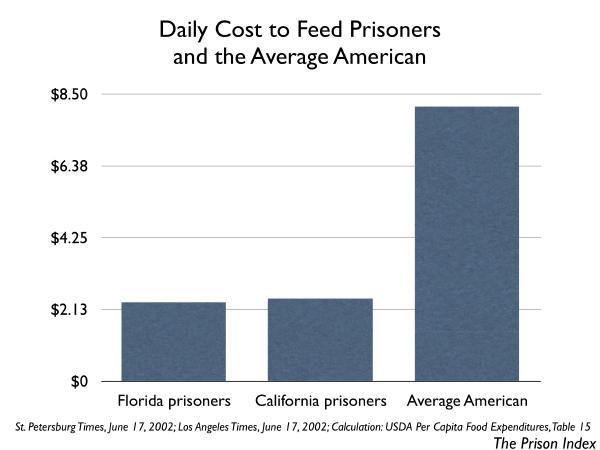
Let them eat...
- Cost charged by the Aramark Corporation to feed each Florida prisoner per day349: $2.32
- Number of years that the California budget for each prisoner's meal has remained unchanged350: 14
- Expenditure on food per California prisoner per day351: $2.45
- Average expenditure on food in the United States per person per day, 2001352: $8.12
Prisoner health
- Percent of jails that do not provide mental health evaluations of their prisoners353: 40%
- Percent of prisons that do not provide mental health evaluations of their prisoners354: 17%
- Percent of state and federal prisons that do not comply with mandatory Tuberculosis screening regulations355: 10%
- Percent of local jails that do not comply with mandatory Tuberculosis screening regulations356: 50%
- Number of Tuberculosis infections detected in admitted prisoners in 2000357: 21,598
- Estimated number of active tuberculosis cases that would be prevented for every 100,000 prisoners tested and treated for TB358: 989
- Maximum estimate of percent of jail inmates screened for syphilis359: 25%
- Costs that could be averted, in dollars, for every 10,000 prisoners given routine syphilis screening and treatment360: $1.6 million
- Percent of prisoners known to be positive for HIV, 2000361: 2.0%
- Percent of U.S. population estimated to be positive for HIV362: 0.3%
- Percent of male prisoners known to be positive for HIV, 2000363: 2.0%
- Percent of female prisoners known to be positive for HIV364: 3.6%
- Of prisoner deaths, percent that are AIDS related365: 6%
- Percent of New York state prisoners known to be HIV positive, 2000366: 8.5%
- Number of confirmed AIDS cases per 10,000 prisoners, 2000367: 52
- Number of confirmed AIDS cases per 10,000 U.S. residents, 2000368: 13
- Estimated number of HIV cases that would be prevented for every 10,000 prisoners offered HIV testing and counseling369: 3
- Estimated number of times prisoners are infected with Hepatitis C compared to the general population370: 9-10
Older prisoners
- Number of prisoners over age 55 in California371: 5,800
- Number of times it is more expensive to incarcerate a prisoner over age 55, compared to a younger prisoner372: 3
- Percent of men paroled after age 55 who return to prison373: 2%
Education programs in prisons
- Percent of prison wardens that strongly support educational and vocational programming374: 93%
- Percent of state prisons that offer vocational training, 2000375: 55.7%
- Percent of state prisoners that have participated in GED/high school programs while in prison, 1997376: 23.4%
- Percent of state prisoners that have participated in college courses while in prison, 1997377: 9.9%
- Percent of state prisoners that have participated in vocational training programs while in prison, 1997378: 32.2%
- Minimum number of college programs in prisons in the United States, 1982379: 350
- In a 1991 New York study, percent of prisoners who enrolled in a college program, did not complete it, and then were released who returned to prison380: 44.6%
- In a 1991 New York study, percent of prisoners who completed a college program who returned to prison381: 26.4%
- Year Congress and President Clinton denied prisoners access to Pell Grants, inspiring most states to eliminate prisoner eligibility for state tuition grants382: 1994
- In 2001, there were less than this number of college programs in prison383: 12
This page is an excerpt from The Prison Index: Taking the Pulse of the Crime Control Industry (April 2003) by Peter Wagner, published by the Western Prison Project and the Prison Policy Initiative.
Footnotes
349 “State: Prison food costs less, but at a price”St. Petersburg Times, June 17, 2002.
350 “For 14 years Inmates have been fed for $2.45 a day”Los Angeles Times, June 17, 2002.
351 “For 14 years Inmates have been fed for $2.45 a day”Los Angeles Times, June 17, 2002.
352 USDA Per Capital Food Expenditures, Table 15. Dividing the 2001 figure by 365 days. http://www.ers.usda.gov/briefing/ CPIFoodAndExpenditures/Data/table15.htm
353 The Health Status of Soon-to-be-Released Inmates A Report to Congress, by National Commission on Correctional Health Care, p. xii.
354 The Health Status of Soon-to-be-Released Inmates A Report to Congress, by National Commission on Correctional Health Care, p. xii.
355 The Health Status of Soon-to-be-Released Inmates A Report to Congress, by National Commission on Correctional Health Care, p. xii
356 The Health Status of Soon-to-be-Released Inmates A Report to Congress, by National Commission on Correctional Health Care, p. xii
357 Corrections Yearbook 2001, p. 48-49.
358 The Health Status of Soon-to-be-Released Inmates A Report to Congress, by National Commission on Correctional Health Care, p. x
359 The Health Status of Soon-to-be-Released Inmates A Report to Congress, by National Commission on Correctional Health Care, p. xii
360 The Health Status of Soon-to-be-Released Inmates A Report to Congress, by National Commission on Correctional Health Care, p. xiii
361 Bureau of Justice Statistics, HIV in Prisons, 2000, p. 2.
362 Centers for Disease Control, Morbidity and Mortality Weekly Report, Feb. 26, 2003, Vol. 52
363 Bureau of Justice Statistics, HIV in Prisons, 2000, p. 3.
364 Bureau of Justice Statistics, HIV in Prisons, 2000, p. 3.
365 Bureau of Justice Statistics, HIV in Prisons, 2000, p. 7.
366 Bureau of Justice Statistics, HIV in Prisons, 2000, p. 2.
367 Bureau of Justice Statistics, HIV in Prisons, 2000, p. 5.
368 Bureau of Justice Statistics, HIV in Prisons, 2000, p. 5.
369 The Health Status of Soon-to-be-Released Inmates A Report to Congress, by National Commission on Correctional Health Care, p. xiii
370 The Health Status of Soon-to-be-Released Inmates A Report to Congress, by National Commission on Correctional Health Care, p. xi
371 “California struggling with growing number of elderly prisoners” Sacramento Bee, June 9 2002
372 “California struggling with growing number of elderly prisoners” Sacramento Bee, June 9 2002
373 “California struggling with growing number of elderly prisoners” Sacramento Bee, June 9 2002
374 Changing Minds, the Impact of College in a Maximum Security Prison, http://www.changingminds.ws
375 Bureau of Justice Statistics, Education and Correctional Populations, Table 3.
376 Bureau of Justice Statistics, Education and Corr ectional Populations, Table 4.
377 Bureau of Justice Statistics, Education and Correctional Populations, Table 4.
378 Bureau of Justice Statistics, Education and Correctional Populations, Table 4.
379 http://www.changingminds.ws/brochure/
380 State of New York Department of Correctional Services, Analysis of Return Rates of the Inmate College Program Participants August, 1991.
381 State of New York Department of Correctional Services, Analysis of Return Rates of the Inmate College Program Participants August, 1991.
382 http://www.changingminds.ws/brochure/ viewed January 3, 2003
383 http://www.changingminds.ws/brochure/ viewed January 3, 2003
Recommended Reading:

The unmet health needs of people in prison
States fall far short of their duty to meet the health needs of incarcerated people.

All profit, no risk
The bail industry exploits cracks and loopholes in the legal system to avoid accountability, while growing its profits.

Compare your state's use of the prison to the world at large
Criminal justice policy in every region of the United States is out of step with the rest of the world.

Prison Gerrymandering Project
We are leading the movement to protect our democracy from the Census Bureau's prison miscount.