Massachusetts profile
Massachusetts has an incarceration rate of 275 per 100,000 people (including prisons, jails, immigration detention, and juvenile justice facilities), meaning that it locks up a higher percentage of its people than almost any democratic country on earth. Read on to learn more about who is incarcerated in Massachusetts and why.
16,000 people from Massachusetts are behind bars

Additionally, the number of people impacted by county and city jails in Massachusetts is much larger than the graph above would suggest, because people cycle through local jails relatively quickly. Each year, at least 70,000 different people are booked into local jails in Massachusetts.
Rates of imprisonment have grown dramatically in the last 40 years

- total numbers rather than rates.
- Women’s prisons: Incarceration Rates | Total Population
- Men’s prisons: Incarceration Rates | Total Population

Today, Massachusetts’s incarceration rates stand out internationally

People of color are overrepresented in prisons and jails


Massachusetts's criminal justice system is more than just its prisons and jails

Reports and briefings about Massachusetts's criminal legal system:
Filter to show
- 58% of people in Massachusetts jails have not been convicted of a crime, meaning they're legally innocent. There are simple steps the state can take to reduce this number. Why isn't it?
- Massachusetts releases roughly 54,270 men and 7,599 women from its prisons and jails each year. What is it doing to support them upon reentry?
- People on parole in Massachusetts can be sent back to prison for "associating" with anyone who has a felony or misdemeanor conviction — even loved ones who are trying to support them
- The parole board in Massachusetts is releasing 43% fewer people and holding 47% fewer hearings since the pandemic started
- Black people in Massachusetts are incarcerated at a rate 7.3 times higher than white people.
- Massachusetts's choice to criminalize "failure to appear" may be hurting public safety
- The cost of incarcerating older people is incredibly high, and their risk of reincarceration is incredibly low, yet 19% of people in Massachusetts prisons are over the age of 55. This is the highest rate in the nation! Why is the state keeping so many older people locked up?
- Prisons in Northeastern states, like Massachusetts, have seen the greatest increase in deaths during heatwaves.
- Massachusetts makes it difficult or even risky for incarcerated journalists to tell their stories.
- Massachusetts is one of 20 states that locks up some people convicted of sex offenses in shadowy "civil commitment" facilities, long after their sentences are over — and often indefinitely
- In Massachusetts, 16,000 people are incarcerated and another 39,400 are on probation or parole.
- Massachusetts charges up to 25¢ for an e-message to or from prison.
- Massachusetts passed a caregiver mitigation and diversion law requiring judges to consider a person's status as a primary caregiver before imposing a sentence and offer alternatives to incarceration when possible.
- Jails in Massachusetts charge up to $3.15 for a 15-minute phone call, reaping profits for companies, while prisons charge up to $1.95 for a 15-minute phone call.
- Some Massachusetts prisons are replacing incarcerated people's personal mail with scans, stifling family contact
- Massachusetts has granted zero commutations to incarcerated people in recent years, including during COVID-19
- In some Massachusetts prisons, incarcerated people are forced to drink and breathe contaminants
- Massachusetts suspended its $3 medical copay for people in prison at the start of the pandemic. It should eliminate this fee permanently.
- If a person in Massachusetts prisons has more than $10 in their commissary account they likely will not qualify for assistance to purchase essentials like hygiene items and postage.
- We do not know how much Massachusetts prisons charge for money transfers — one of the only states we don’t have data on.
- With an incarceration rate of 275 per 100,000 residents, Massachusetts locks up a higher percentage of its people than almost any democratic country on earth.
- We gave Massachusetts a "D" grade in September 2021 for its response to the coronavirus in prisons.
- Massachusetts hurts jury diversity by excluding people with felony records
- How many COVID-19 cases in Massachusetts communities can be linked to outbreaks in correctional facilities? (data from our report Mass Incarceration, COVID-19, and Community Spread)
- We graded the parole release systems of all 50 states — Massachusetts gets an F
- People in Massachusetts jails often face high first-minute rates for phone calls
- Massachusetts women do not need a new jail
- The Company Store: A deeper look at prison commissaries in Massachusetts
- Massachusetts incarcerates women at a rate of 40 per 100,000 residents — higher than almost any democratic country on earth.
- Research from Massachusetts: Prisons could do much more to prevent opioid overdose deaths among people leaving prison
- People in Massachusetts prisons earn as little as 14¢ an hour for their work.
 Punishing Poverty: The high cost of probation fees in Massachusetts
- Protecting visitation and mail in Massachusetts prisons.
- Massachusetts removes major roadblock to re-entry: unnecessary license suspensions
- Ending harmful driver's license suspensions in Massachusetts
- Massachusetts Chief Justice Gants cites our research, calls for reform
- Prison Policy Initiative helps overturn a harmful banishment ordinance in Massachusetts
- Massachusetts delivers prison gerrymandering resolution to Census Bureau
- Massachusetts Legislature Calls on U.S. Census Bureau: Support Fair Redistricting, End Prison Gerrymandering
- Mass. anti-shackling bill signed into law
- Massachusetts women need more services, not more jail cells
- Prison Gerrymandering in Massachusetts: How the Census Bureau prison miscount invites phantom constituents to town meeting
- Mass. court to decide when sentencing enhancement zone reform takes effect
- New video: The high cost of calls home from the Hampden County Jail
- Mass. Legislature should pass Innocence Commission bill
- Massachusetts residents say NO to prison visitor dog sniffing policy
- Letter Urging the Massachusetts Department of Corrections to not subject prison visitors to dog searches
-
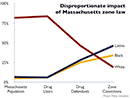 Reaching too far, coming up short: How large sentencing enhancement zones miss the mark
 - "Smart on crime": Our letter to the Boston Herald
- "School Zone Laws Don’t Work": Our letter to the Valley Advocate
- Prison Policy Initiative on Massachusetts's counter-productive plan to charge prisoners for their incarceration
- Importing Constituents: Prisoners and Political Clout in Massachusetts
- PRRAC Researcher Report: Sentencing Enhancement Zones Fail to Protect Children (Poverty & Race, November/December 2008)
-
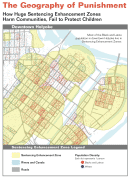 The Geography of Punishment: How Huge Sentencing Enhancement Zones Harm Communities, Fail to Protect Children, by Aleks Kajstura, Peter Wagner and William Goldberg, July 2008
- Affidavit of Peter Wagner, August 14, 2006 in opposition to a Revere, MA city ordinance that would banish people classified as level 3 sex offenders from the city.
-
 Do you know where the children are? A Report of Massachusetts Youth Unlawfully Held Without Bail, by Barbara Fedders (Criminal Justice Institute at Harvard Law School and Prison Policy Initiative Board Member) and Barbara Kaban (Children’s Law Center), September 15, 2006
 - "Don’t sink more funds into jails for women": Our letter to the Daily Hampshire Gazette, April 2006
- Jim Crow in Massachusetts? Prisoner disenfranchisement, by Peter Wagner, October 31, 2004.
- Massachusetts Disenfranchises its Prisoners November 2000, written for Mass Dissent


Other resources
- Research on Massachusetts in our Research Library
- Ending prison gerrymandering in Massachusetts campaign and resource page


