New data reveals where people in California prisons come from
Report shows every community in California is harmed by mass incarceration
August 31, 2022
Today the Essie Justice Group and the Prison Policy Initiative released a new report, Where people in prison come from: The geography of mass incarceration in California, that provides an in-depth look at where people incarcerated in California state prisons come from. The report also provides 20 detailed data tables — including localized data for Los Angeles, San Diego, San Jose, San Francisco, Fresno and Santa Clara County — that serve as a foundation for advocates, organizers, policymakers, data journalists, academics and others to analyze how incarceration relates to other factors of community well-being.
The data and report are made possible by the state’s landmark 2011 law that requires that people in prison be counted as residents of their hometown rather than in prison cells when state and local governments redistrict every ten years.
The report shows:
- Every single county — and every state legislative district — is missing a portion of its population to incarceration in state prison.
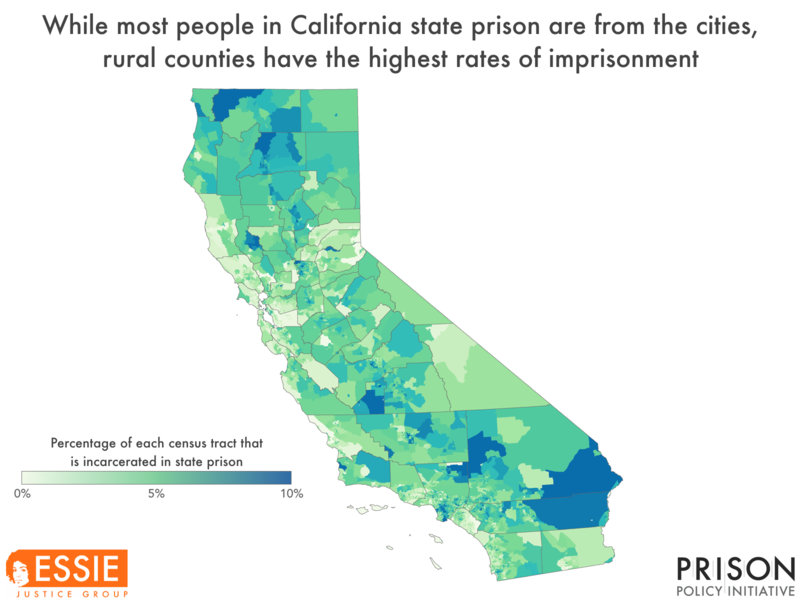
- While no county sends as many people to prison as Los Angeles County, many of the state’s smaller counties, including Kings, Shasta, Tehama, and Yuba, have a far larger portion of their residents imprisoned.
- Native reservation and trust land in California has an imprisonment rate of 534 per 100,000 people, nearly double the state average of 310 per 100,000.
- There are dramatic differences in incarceration rates within communities, often along racial and economic lines. For example, in Los Angeles the 14 neighborhoods with the highest imprisonment rates are clustered in South Central Los Angeles, where 57% of residents are Latino, 38% are Black, and 2% are white. Meanwhile, the LA neighborhoods with the lowest imprisonment rates are mostly in the predominately white and wealthier Westside region.
- The large number of adults extracted from a relatively small number of geographical areas seriously impacts the health and stability of the families and communities left behind. It specifically impacts women and gender non-conforming people, where 1 in 4 women and 1 in 2 Black women have an incarcerated loved one.
Data tables included in the report provide residence information for people in California state prisons at the time of the 2020 Census, offering the clearest look ever at which communities are most impacted by mass incarceration. They break down the number of people locked up by county, city, town, zip code, legislative district, census tract and other areas.
The data show the counties with the highest state prison incarceration rates are Kings (666 per 100,000 residents), Shasta (663 per 100,000 residents) and Tehama (556 per 100,000 residents). For comparison, Marin County has the lowest prison incarceration rate, at 80 people in state prison per 100,000 residents, more than 8 times lower than Kings County.

“The nation’s 40-year failed experiment with mass incarceration harms each and every one of us. This analysis shows that while some communities are disproportionately impacted by this failed policy, nobody escapes the damage it causes,” said Emily Widra, Senior Research Analyst at the Prison Policy Initiative. “Our report is just the beginning. We’re making this data available so others can further examine how geographic incarceration trends correlate with other problems communities face.”
The report cites studies that show that incarceration rates correlate with a variety of negative outcomes, including higher rates of asthma, depression, lower standardized test scores, reduced life expectancy and more. The data included in this report gives researchers the tools they need to better understand how these correlations play out in California.
“When someone is incarcerated, families and communities are destabilized and women-especially Black women, bear the burdens of mass incarceration through financial devastation and profound health implications. This report provides the most cutting-edge data we have to date to help us better understand how specific regions of the state are experiencing incarceration,” said Felicia Gomez, Senior Policy Associate at Essie Justice Group. “We now have an additional layer of analysis, that connected to the lived experiences of women with incarcerated loved ones, sheds light on which regions in California are sending the most people to prison and how that is impacting communities and their constituents. And just as importantly, it uplifts the urgent need for the state to close more prisons and make full investments into care and community safety.”
The report is part of a series of reports examining the geography of mass incarceration in America.
California is one of more than a dozen states and 200 local governments that have addressed the practice of “prison gerrymandering,” which gives disproportional political clout to state and local districts that contain prisons at the expense of all of the other areas of the state. In total, roughly half the country now lives in a place that has taken action to address prison gerrymandering.


