New data on HIV in prisons during the COVID-19 pandemic underscore links between HIV and incarceration
The percent of people in prison with HIV barely budged despite the heightened risks of COVID-19 to immunocompromised individuals. We review the evidence connecting the parallel epidemics of HIV and incarceration, which disproportionately impact Black men in the South.
by Emily Widra, June 1, 2023
The rate of new HIV diagnoses in the U.S. has been steadily declining for decades, but people in prisons are still disproportionately living with the virus. New data from the Bureau of Justice Statistics (BJS) report HIV in Prisons, 2021 indicates that some state prison systems are completely out-of-step with the rest of the nation and have experienced an increase in HIV prevalence since 1991.1 Some of this increase reflects vast improvements made in health care that allow people with HIV to live longer than in the early years of the epidemic. More concerningly, some of the increase appears to be tied to the mass incarceration of Black people and the oft-ignored epidemic of HIV among Black men in the South.
In addition to national and regional trends in HIV prevalence in prisons, and the twin epidemics of HIV and mass incarceration, this briefing highlights BJS data on prison testing policies and research on the criminalization of the virus in the U.S.
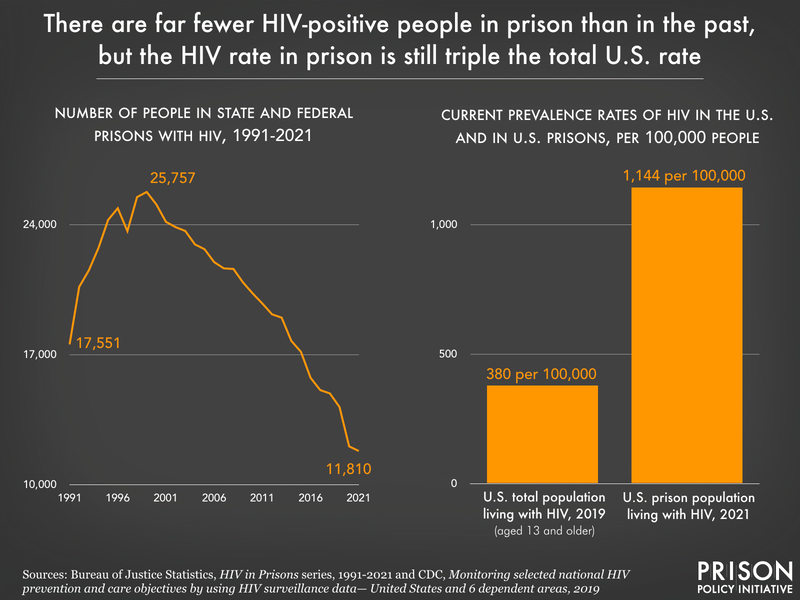
Nationally, HIV rates in prison greatly outpace the general population
Overall, the percent of the U.S. prison population that is living with HIV steadily declined from the 1990s to 2016. At its peak in 1992, 2.5% of people in all state and federal prisons were HIV-positive.2 By 2016, this had decreased to 1.2%.
New 2021 data from the Bureau of Justice Statistics shows that, while the overall number of imprisoned people with HIV has declined, the portion of the prison population living with the virus has not changed in the past five years. In fact, the recent 0.1% change in the percent of the overall prison population living with HIV is entirely attributable to a change in the percent of HIV-positive people in federal prisons, which decreased from 1% of the federal prison population in 2020 to 0.9% in 2021.
And while we see little change in the prevalence of HIV in prisons in recent years, the comparison to the general U.S. population is startling. The prevalence rate of HIV in the U.S. in 2019 was 380 per 100,000 people,3 while the total U.S. prison population faces a rate that is more than 3 times as high: 1,144 per 100,000 people in prison had HIV in 2021.
In some prisons, HIV prevalence rose as COVID-19 pandemic advanced
The Bureau of Justice Statistics reports that 2019 to 2020 represented the largest one-year decline in the number of people in prison with HIV (down 15%) since data collection began and explains that this was “largely as a result of the COVID-19 pandemic.” Readers might optimistically interpret this as evidence that prisons were rightly concerned about the heightened risk COVID-19 posed to immunocompromised people, such as those diagnosed with HIV. Unfortunately, when we take a closer look at the data, it’s hard to say whether that was the case.
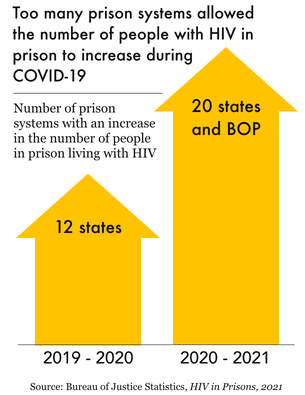
Figure 2.
In fact, some states seemed either oblivious to – or, less generously, unbothered by – the additional risks that COVID-19 poses to people with HIV. In 12 states, the number of HIV-positive people in prison actually increased from 2019 to 2020, suggesting significant state-by-state variation during the pandemic. And as states ended COVID-19 emergency responses in 2021, these variations did not improve: From 2020 to 2021, 20 states and the federal Bureau of Prisons saw an increase in the number of imprisoned people with HIV. This suggests that any positive changes made in reducing the HIV-positive prison population during COVID-19 are set to return to pre-pandemic levels.
Nationally, the 15% decline in the number of HIV-positive people in prison amounts to just over 2,000 people. If every one of them were actually released from prison directly as a response to COVID-19, this would be worth noting as an accomplishment in mitigating the risk of deadly disease among immunocompromised people. However, this decrease was proportionally the same as the overall drop in the prison population that year, and the actual percent of the prison population living with HIV did not change in any significant way. Therefore, it seems unlikely that the drop in the HIV-positive prison population was the result of a targeted effort to protect the health of these individuals.
Black men are hit the hardest by HIV and incarceration
The Bureau of Justice Statistics has not provided data on the race of imprisoned people living with HIV since 2004.4 The last time it published this data nearly 20 years ago, BJS reported that, among the more than 15,400 people in state prisons that self-reported positive HIV test results, 53% were Black, 22% were white, and 19% were Hispanic or Latino. Until more recently, the Bureau’s HIV in Prisons series also included a breakdown of HIV-related deaths by race; in 2019, the mortality rate for HIV-related deaths among Black people in prison was three times the rate of HIV-related deaths of all people in prison (1 per 100,000).5
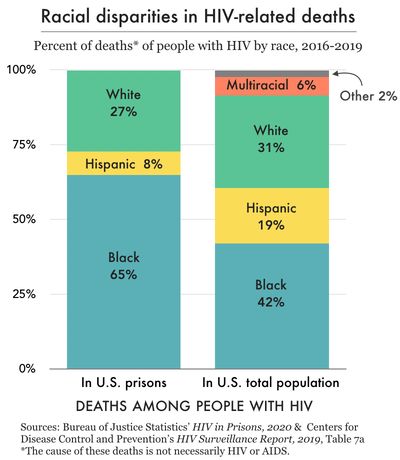
Figure 3.
Unfortunately, while there is little other data on the overlap between incarceration, race, and HIV, we do know that Black people are disproportionately affected by both mass incarceration and HIV. This is not a coincidence, as our 2017 briefing on the subject explains. Black people are vastly overrepresented in the U.S. prison population: in 2021, Black people were imprisoned at a rate of 1,186 per 100,000 adults, more than five times the rate of white adults and more than twice the overall adult imprisonment rate of the U.S.
Not only do Black people make up 33% of people in prison while only representing about 14% of the entire U.S. population, but they account for more than 40% of people living with diagnosed HIV. Black men in particular are hit the hardest by both imprisonment and HIV: they accounted for 31% of all people in prison in 2021 and 26% of all HIV-positive people in the U.S. in 2019.6
The racial disparities observed in prison HIV prevalence rates are mirrored in prison mortality rates.7 From 2016 to 2019, there were 114 deaths of people with HIV in prison (of any cause), and 74 of these deaths (65%) were of incarcerated Black people (see Figure 3). In 2019, 12 of the 17 deaths of people with HIV in prison (71%) were of non-Hispanic Black men, specifically. These racial disparities persist outside of prisons as well: 43% of people with AIDS8 who died (of any cause) in 2019 were Black.9
Regional differences: HIV prevalence in the South
In 2017, we summarized the limited existing research on the ways in which Black men face the parallel epidemics of HIV and mass incarceration, with a focus on the effect in Southern states. The HIV prevalence rate in the South10 is 379 per 100,000 residents, which is more than twice the rate in the Midwest and well above the national rate of 318 per 100,000.11
This pattern appears to hold true in prisons as well: All seven states with the nation’s highest rates of HIV in prison are in the South: Florida, Mississippi, Louisiana, Maryland, Tennessee, Georgia, and South Carolina. In fact, all of the states with more than 2% of their prison population living with HIV are in the South: Florida (2.8%), Mississippi (2.5%), and Louisiana (2.5%). These Southern state prison systems also have some of the most significant racial disparities in the nation, supporting the correlation between HIV and the incarceration of Black people.
From 1991 to 2014, the New York state prison system was the prison system with the highest HIV prevalence rate in the country.12 But starting in the mid-2000s, while Northern state prisons were seeing major decreases in HIV prevalence, Southern state prison systems witnessed the opposite. States like New York, Connecticut, and Massachusetts saw sizable drops of 12, 4, and 4 percentage points respectively in the last 30 years, while Louisiana, Tennessee, and Mississippi have seen steadily rising HIV prevalence in prisons.
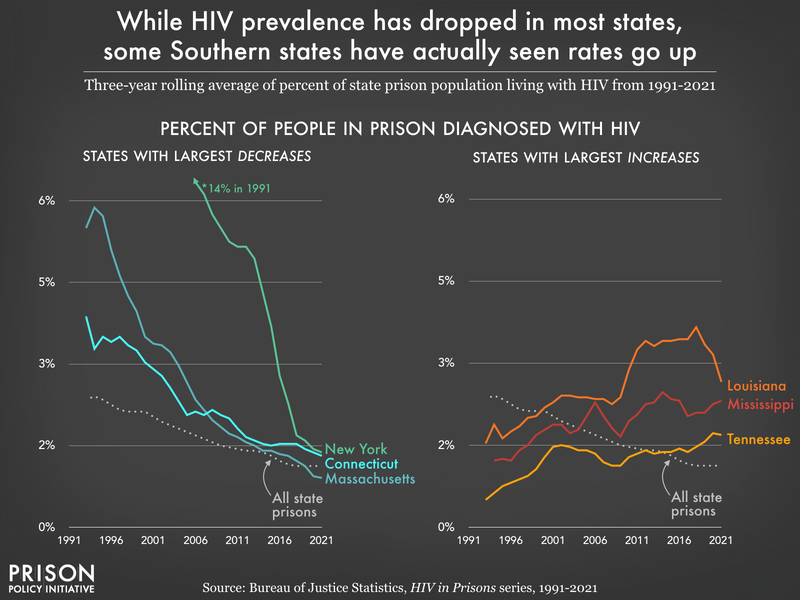
2015 was the last year that New York had the prison system with the largest portion of the population living with HIV. Since then, Louisiana (2016-2020) and Florida (2021) have had the highest in-prison HIV prevalence rates in the country: in 2021, 2.8% of people in Florida prisons had HIV.
HIV testing: Vast differences in prison policies
While most prison systems in the U.S. provide mandatory or “opt-out” HIV testing during admission,13 there are a few concerning gaps in testing policies across the country. Ten of the 50 reporting prison systems14 only offer tests if they are requested (“opt-in”) or based on a clinical medical evaluation. Only 18 states offer HIV testing during routine medical care for all imprisoned people, while all other states and the federal Bureau of Prisons only offer tests by-request during clinical visits for people the prison system has identified as vulnerable to HIV, or when someone is involved in “an incident.”15
Only one state – Texas – mandates HIV testing prior to release. Nine other states (accounting for a total of 20% of all 2021 prison releases) offer optional HIV testing to all people during their discharge planning process. Among the ten states with the highest HIV prevalence in prisons, nine of them offer HIV testing upon release; Mississippi – with the third highest rate of HIV – does not offer testing at all prior to release.
The criminalization of HIV across the U.S.
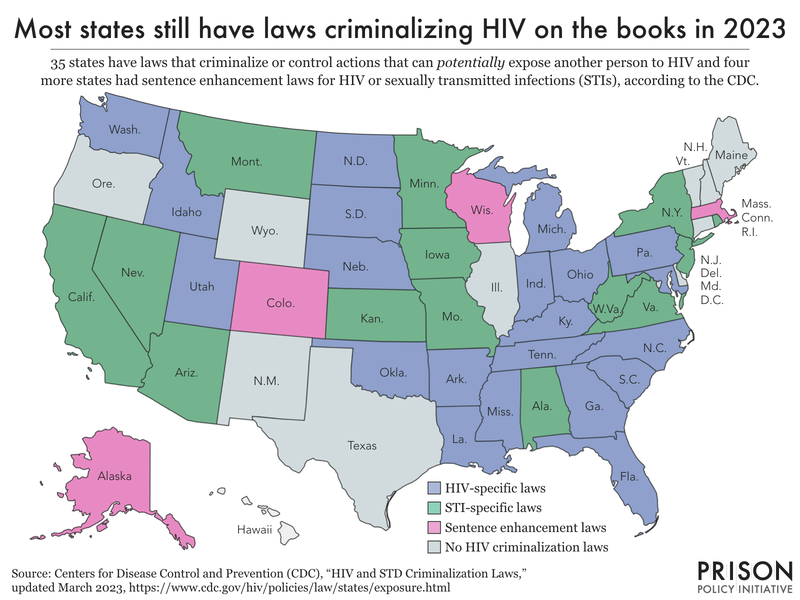
According to the Centers for Disease Control (CDC), 35 states have laws that criminalize HIV exposure and four more states have sentence enhancement laws for HIV or sexually transmitted infections (STIs). The criminalization of HIV refers to the existence and enforcement of criminal laws that rely on HIV status as the “foundation for criminalizing otherwise legal conduct” or for increasing punishments related to solicitation and sex offenses. The CDC classifies these types of laws in three categories:
- HIV-specific laws that criminalize or control actions that can potentially expose another person to HIV. (21 states)
- Sexually transmitted infection (STI), communicable, contagious, infectious disease laws that criminalize or control actions that can potentially expose another person to STIs/communicable/infectious disease. This might include HIV. (14 states)
- Sentence enhancement laws specific to HIV, or STIs, that do not criminalize a behavior but increase the sentence length when a person with HIV commits certain crimes. (4 states)
HIV disproportionately affects gay and bisexual men (and other men who have sex with men), Black and Hispanic people, and people who inject drugs. Similarly, people identifying as lesbian, gay, and bisexual, Black and Hispanic people, and people with substance use disorders are targeted for policing and overrepresented in the national prison population. We cannot draw conclusions about just how much effect HIV criminalization laws have on the number of people with HIV in prison, in part because HIV or STI-specific laws are not often considered the “most serious offense,” are often a “lesser offense” contributing to sentencing, and therefore are not denoted in most criminal legal system data. However, we know that many of the same people who are most vulnerable to HIV infection are also disproportionately affected by both HIV criminalization laws and mass incarceration.
HIV criminalization in the South: A closer look at Florida
In the South, the overlap between HIV prevalence in prisons, HIV criminalization, and incarceration is stark. Eleven of the 17 Southern states (as defined by the CDC) have HIV-specific criminalization laws on the books. An additional three states have enacted STI-specific laws. Florida presents a particularly egregious example of how these dynamics can coincide.
In 2021, Florida had the highest in-prison HIV rate with 1,800 HIV-positive people in prison (almost 3% of the state’s prison population). The state also has some of the most oppressive HIV-related criminal laws. The Williams Institute at UCLA has reported in-detail about specific statutes that criminalize HIV in Florida, including offenses that criminalize people living with HIV and other sexually transmitted diseases “in the contexts of sex work, donation of blood and other bodily products, and consensual sex without disclosure.” Florida also has sentence enhancements for “certain non-consensual sex offenses where the defendant has a previous positive HIV test.”
Importantly, all of these statutes are broad enough to criminalize conduct that cannot actually lead to transmission of the virus,16 resulting in charges and convictions based on HIV status alone.
From 1997 to 2020, at least 154 people were imprisoned in Florida for HIV-related offenses,17 including those listed above. While this may be a small percentage of the overall Florida prison population (which was the third largest state prison system in 2021), it’s important to note that these 154 people did not have a “more serious offense” other than their HIV-related offense, and that the enforcement of such laws disproportionately targets women, Black people, and people who engage in sex work:
- Gender. Women made up 27% of people living with HIV in Florida in 2018, but 51% of those with HIV-related prison sentences.
- Race. Black people made up 45% of people living with HIV in Florida in 2018, but 56% of people with prison sentences for HIV-related crimes.
- Sex work. Six-in-ten HIV-related convictions in Florida were connected to sex work.
In addition to the criminalization of already-vulnerable people living with HIV, the cost of incarceration associated with Florida’s HIV criminalization laws has been more than $15 million over the past 23 years.
Florida is not the only state that criminalizes HIV, as we discussed above. Other states with the highest rates of HIV in prison – Louisiana and Georgia – have HIV criminal laws on the books, too.
Conclusion
Though some states and the Bureau of Prisons have seen rising prevalence rates of HIV since the pandemic began, the portion of the overall prison population living with the virus has changed little since 2016. There are fewer people living with HIV in prison than there were in the early 2000s, but one-in-seven HIV-positive people still pass through the U.S. prison system each year. Thousands of people across the country who are facing chronic illness, and who require consistent medical care, are locked up in settings where health care is grossly inadequate. This is true not only for people with HIV but anyone with infectious, long-term, or chronic illnesses.
The fact that nearly three times as many imprisoned people are facing HIV compared to the general public creates a critical imperative for targeted public health interventions among these populations, including increased sexual health care and education in prisons, greater access to testing and treatment, and stronger post-release services that help people transition their care into the community. It also underscores the need to address the issue at the front-end of the system by ending the criminalization of people with HIV and addressing the targeted policing of populations that have been made particularly vulnerable to the virus.
Footnotes
-
Throughout this briefing, “prevalence” is defined as the percent of people living with HIV in the total population. While public health officials often utilize “incidence rate” – the number of new diagnoses per 100,000 – this is unfortunately not compatible with any of the HIV data published by the Bureau of Justice Statistics in the HIV in Prisons series. ↩
-
This is based on available data from BJS from 1991-2021. ↩
-
This is the rate of persons (aged 13 years old and older) living with a diagnosed HIV infection, year-end 2019, as reported by the Centers for Disease Control and Prevention (CDC) in the annual report: “Monitoring selected national HIV prevention and care objectives by using HIV surveillance data–United States and 6 dependent areas, 2019.”
There is 2020 data available from the CDC, although the agency cautions against using this data “due to the impact of the COVID-19 pandemic on access to HIV testing, care-related services, and case surveillance activities in state and local jurisdictions.” In light of this, we opted to exclude 2020 HIV data from the CDC throughout this briefing, and use 2019 to represent the most recent data.
↩ -
The National Prisoners Statistics survey does not collect race data for people in prison with HIV, either. ↩
-
In the 2021 iteration of HIV in Prisons, the Bureau of Justice Statistics states: “Data on deaths are no longer presented in this report. BJS ceased collection of detailed mortality data in state and local correctional facilities after the 2019 data year.” ↩
-
These percentages were calculated from Table 16a in “Persons living with diagnosed HIV infection, by race/ethnicity and selected characteristics, year-end 2019 – United States.”
In addition, it is worth noting that almost twice as many Black men are living with HIV than Black women.
↩ -
The HIV in Prisons series collected and published mortality data on HIV up until 2019, but has since stopped publishing this data. In addition, there is an information vacuum regarding deaths in custody, leaving advocates, researchers, reporters, and government officials with little-to-no data to understand trends in, and the causes of, deaths in U.S. prisons and jails. For more about this data gap, see Seven years after the deadline – still no complete data or analysis from DOJ on deaths in custody from the UCLA Law COVID Behind Bars Project and their newest project, the Carceral Mortality Project. ↩
-
These data – collected and published by the CDC – provide the number of deaths of “persons with diagnosed HIV infection ever classified as stage 3 (AIDS)” and that these deaths “may be due to any cause.” Of note, this is a different definition than the BJS prison death data, but it is the closest comparison we could find. Centers for Disease Control and Prevention, National Center for Health Statistics. National Vital Statistics System, Mortality 2018-2021 on CDC WONDER Online Database, released in 2021. Data are from the Multiple Cause of Death Files, 2018-2021, as compiled from data provided by the 57 vital statistics jurisdictions through the Vital Statistics Cooperative Program. ↩
-
Further evidence of the racial disparities and disproportionate effect of HIV among Black men in particular is evident in the 2021 CDC data as well: Black people accounted for 50% of the approximately 5,000 AIDS-caused deaths in the U.S. and 30% of all AIDS-caused deaths were of Black men in particular. ↩
-
The CDC classifies the South as Alabama, Arkansas, Delaware, District of Columbia, Florida, Georgia, Kentucky, Louisiana, Maryland, Mississippi, North Carolina, Oklahoma, South Carolina, Tennessee, Texas, Virginia & West Virginia. ↩
-
This trend is also present in the regional differences in incidence rates of HIV: the rate of new diagnoses of HIV is highest in the South, at 15.2 per 100,000 people, which is 60% higher than the incidence rate in the Northeast. ↩
-
This is not necessarily surprising, as New York City was one of the hardest hit cities by the HIV epidemic in the U.S. And while New York City – and the state of New York – have seen significantly declining rates of new diagnoses, the city “continues to have one of the largest HIV epidemics in the United States.” ↩
-
Opt-out testing refers to policies that mandate that everyone is offered a test and will receive a test unless they explicitly decline it. ↩
-
The 50 reporting prison systems include 49 state prisons and the federal Bureau of Prisons. Alaska did not report data on testing practices during the intake process for the 2020 or 2021 survey. ↩
-
The survey BJS disseminates to compile data for the HIV in Prisons series does not define vulnerable populations (or “high risk” in BJS parlance), nor does it explain what constitutes “an incident.” Instead, BJS permits the responding prison systems to check a box to indicate they offer testing after involvement in “an incident” without further clarification. There is likely significant variation between prison systems with regard to how they determine who is particularly vulnerable to HIV and what “incidents” trigger the offer of HIV testing. For example, the data does not indicate if people are offered HIV tests after working a shift in the infirmary, after having an injury, or after being assaulted by staff or other people in prison. We also cannot be sure who the prison systems are classifying as particularly vulnerable to HIV infection, such as people getting tattoos or people with histories of intravenous drug use.
For the relevant survey questions about HIV, see “Section V — HIV/AIDS” of the National Prisoner Statistics Summary of Sentenced Population Movement 2021 (Form NPS-1B).
↩ -
For example, while we know HIV is transmissible through blood transfusions, the donation process involves thorough testing and it is extremely unlikely that anyone will contract HIV through blood or organ donation. Florida’s law criminalizing the donation of blood or organs for people who are living with HIV is unnecessary given the extent of testing conducted on donated blood and organs. ↩
-
This means that their “most serious offense” was an HIV-related offense, not something else that would be considered more “serious,” like homicide or burglary. ↩


