HELP US END MASS INCARCERATION
The Prison Policy Initiative uses research, advocacy, and organizing to dismantle mass incarceration. We’ve been in this movement for 23 years, thanks to individual donors like you.
Can you help us sustain this work?
Thank you,
Peter Wagner, Executive Director Donate
Can you help us sustain this work?
Thank you,
Peter Wagner, Executive Director Donate

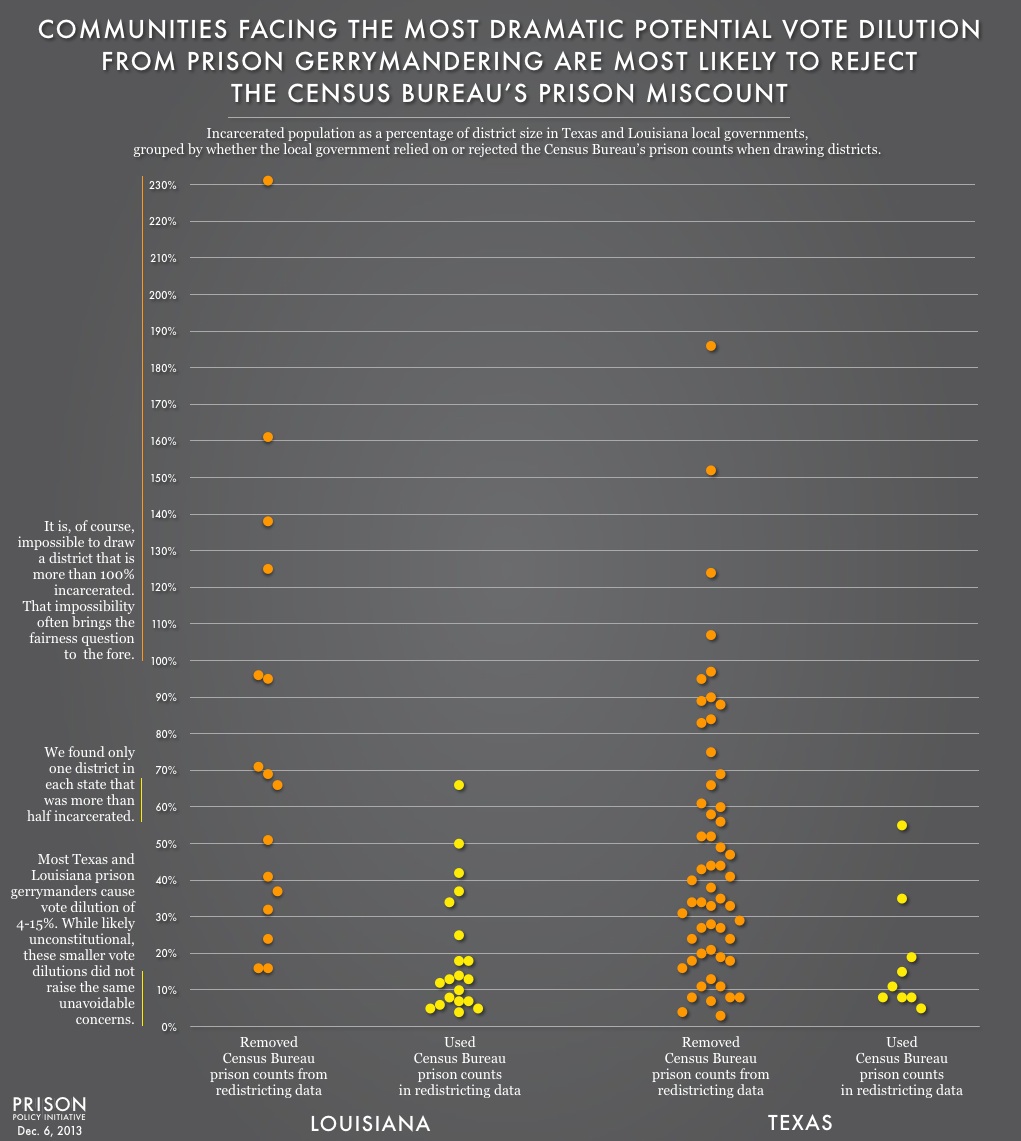
Data Source: Prison Policy Initiative original research. (Graph: Peter Wagner, 2013)
This graph originally appeared in Avoiding prison gerrymandering is often a matter of common sense: Texas and Louisiana research update.


