Can you help us sustain this work?
Thank you,
Peter Wagner, Executive Director Donate

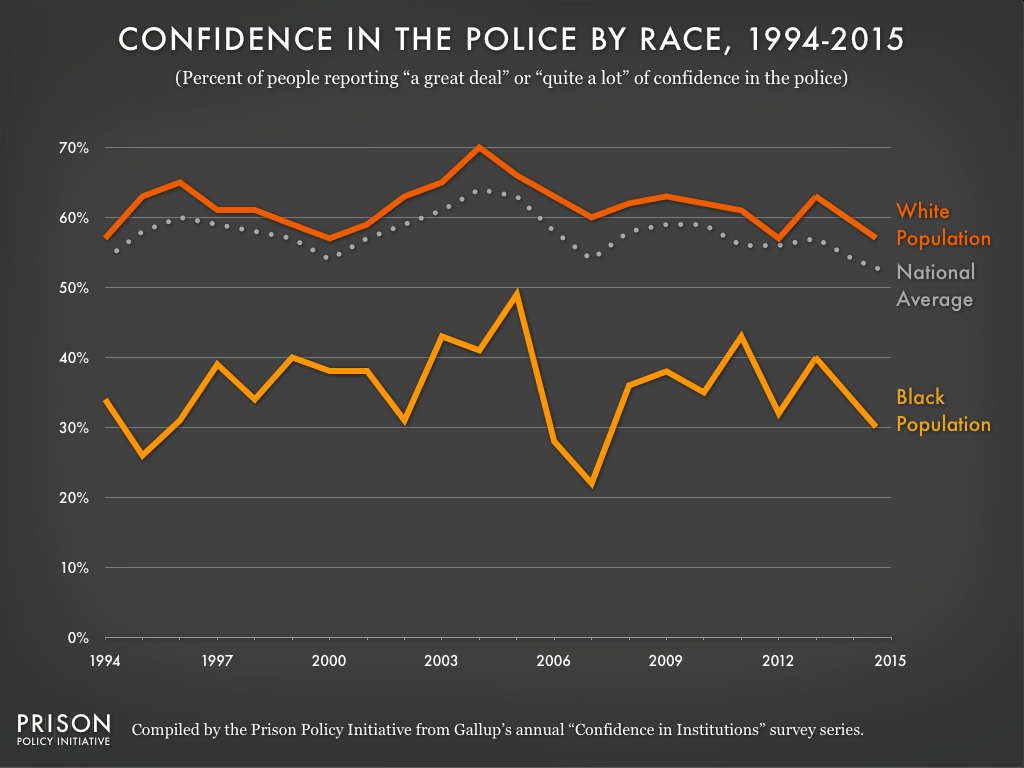
Data Source: Compiled by the Prison Policy Initiative from Gallup's Annual "Confidence in Institutions" survey series. (Graph: Rachel Gandy, 2015)
This graph originally appeared in One institution, two different views: How Black and White Americans regard the police.
Each year, Gallup asks a random sample of U.S. adults the following question: "I am going to read you a list of institutions in American society. Please tell me how much confidence you, yourself, have in each one-a great deal, quite a lot, some, or very little: the police?" This graph shows the percentage of people by race who answered that they had "a great deal" or "quite a lot" of confidence in the police. Whites consistently report higher levels of confidence in the police than the average American, while Blacks report markedly lower confidence levels than the average American.


