HELP US END MASS INCARCERATION
The Prison Policy Initiative uses research, advocacy, and organizing to dismantle mass incarceration. We’ve been in this movement for 23 years, thanks to individual donors like you.
Can you help us sustain this work?
Thank you,
Peter Wagner, Executive Director Donate
Can you help us sustain this work?
Thank you,
Peter Wagner, Executive Director Donate

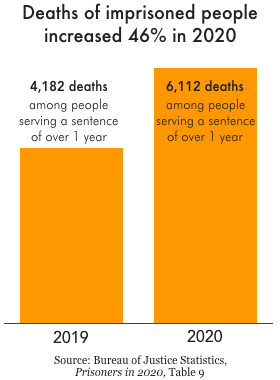
Data Source: Bureau of Justice Statistics, Prisoners in 2020 Table 9. (Graph: Wendy Sawyer, 2022)
This graph originally appeared in New data: The changes in prisons, jails, probation, and parole in the first year of the pandemic.


