HELP US END MASS INCARCERATION
The Prison Policy Initiative uses research, advocacy, and organizing to dismantle mass incarceration. We’ve been in this movement for 23 years, thanks to individual donors like you.
Can you help us sustain this work?
Thank you,
Peter Wagner, Executive Director Donate
Can you help us sustain this work?
Thank you,
Peter Wagner, Executive Director Donate

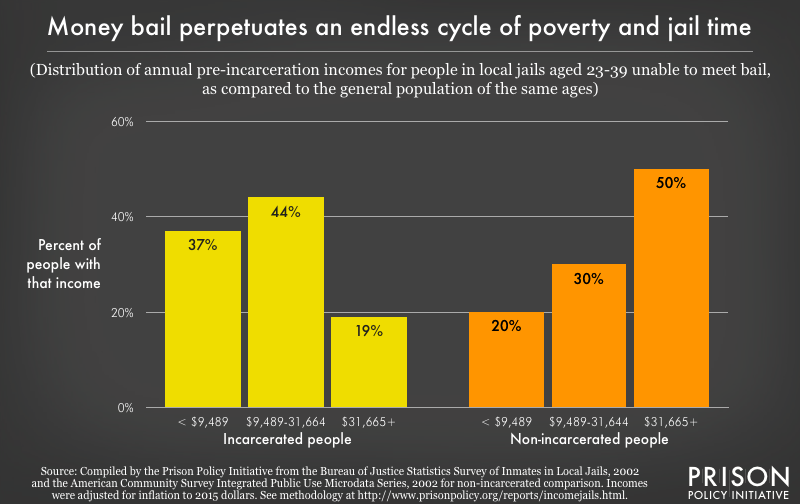
Data Source: Compiled by the Prison Policy Initiative from the Bureau of Justice Statistics Survey of Inmates in Local Jails (2002), the American Community Survey Integrated Public Use Microdata Series (2002), adjusted for inflation to 2015 dollars. See methodology in the full report. (Graph: Bernadette Rabuy & Daniel Kopf, 2016)
This graph originally appeared in Detaining the Poor: How money bail perpetuates an endless cycle of poverty and jail time.
People in local jails unable to meet bail are concentrated at the lowest ends of the national income distribution. As this graph shows, 37% had no chance of being able to afford the typical amount of money bail since their annual income is less than the median bail amount.


