HELP US END MASS INCARCERATION
The Prison Policy Initiative uses research, advocacy, and organizing to dismantle mass incarceration. We’ve been in this movement for 23 years, thanks to individual donors like you.
Can you help us sustain this work?
Thank you,
Peter Wagner, Executive Director Donate
Can you help us sustain this work?
Thank you,
Peter Wagner, Executive Director Donate

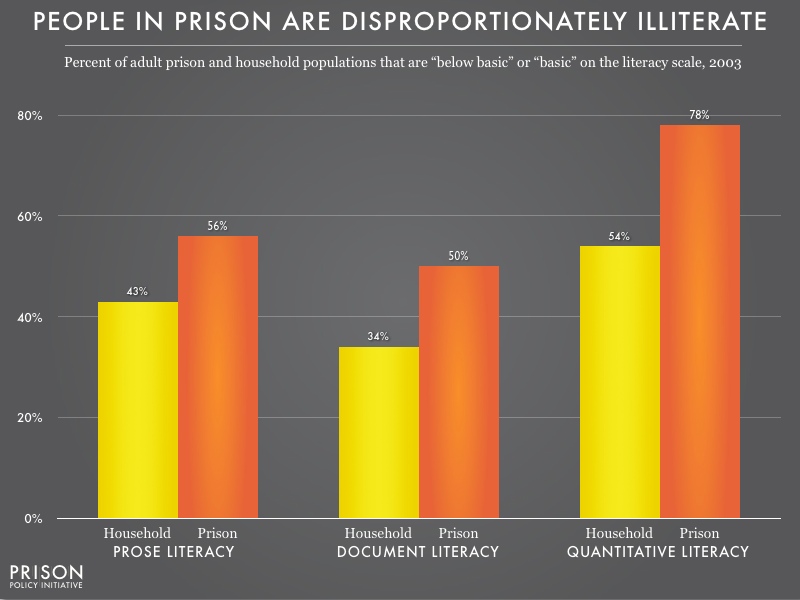
Data Source: Prison Policy Initiative analysis of the U.S. Department of Education National Assessment of Adult Literacy (NAAL) Survey, 2003. (Graph: Corey Michon, 2016)
This graph originally appeared in Uncovering Mass Incarceration’s Literacy Disparity.
People in prison are 13 to 24 percent more represented in the lowest levels of literacy than people in the free world. The smallest disparity is for prose literacy, and the largest disparity is for quantitative literacy. (For an explanation of the different types of literacy, and why “basic” literacy is inadequate for our modern society, see the original post).


