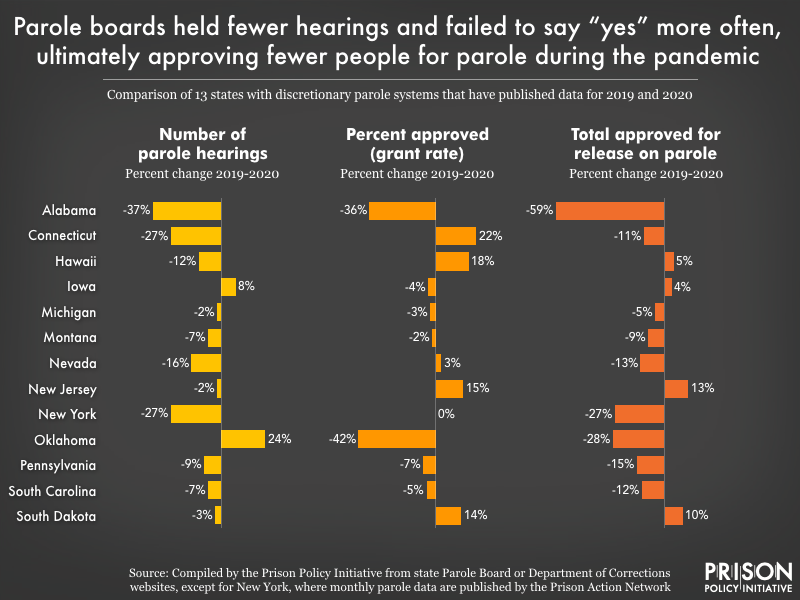
Data Source: Compiled by the Prison Policy Initiative from state Parole Board or Department of Corrections websites, except New York, where monthly parole data are published by the Prison Action Network. (Graph: Tiana Herring, 2021)
This graph originally appeared in Parole boards approved fewer releases in 2020 than in 2019, despite the raging pandemic.


