HELP US END MASS INCARCERATION
The Prison Policy Initiative uses research, advocacy, and organizing to dismantle mass incarceration. We’ve been in this movement for 23 years, thanks to individual donors like you.
Can you help us sustain this work?
Thank you,
Peter Wagner, Executive Director Donate
Can you help us sustain this work?
Thank you,
Peter Wagner, Executive Director Donate

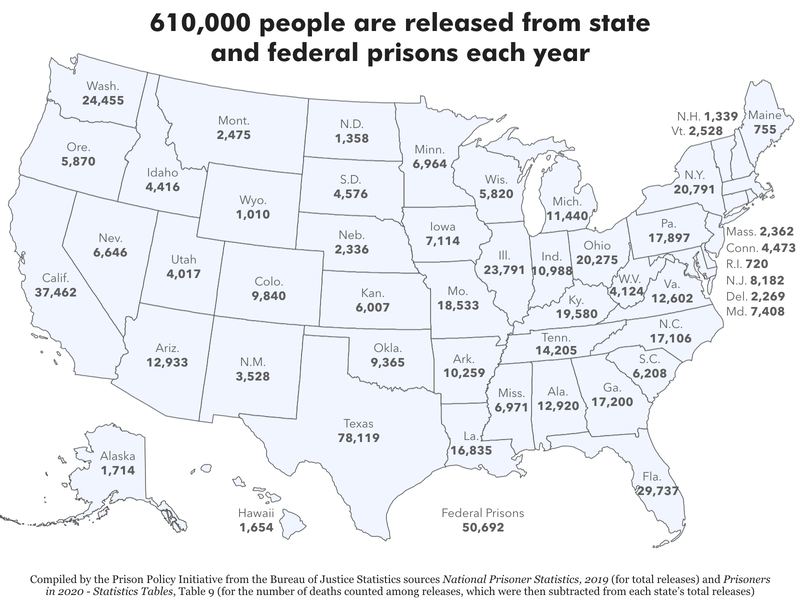
Data Source: Bureau of Justice Statistics' National Prisoner Statistics, 2019 (for total releases) and Prisoners in 2020 - Statistics Tables, Table 9 (for number of deaths counted among releases, which were subtracted from release counts). (Graph: Wendy Sawyer, 2022)
This graph originally appeared in Since you asked: How many people are released from each state’s prisons and jails every year?.
This map doesn’t include people who are released from local jails, which experience much higher rates of population turnover (sometimes referred to as “jail churn”) due to shorter average length of stay.


