HELP US END MASS INCARCERATION
The Prison Policy Initiative uses research, advocacy, and organizing to dismantle mass incarceration. We’ve been in this movement for 23 years, thanks to individual donors like you.
Can you help us sustain this work?
Thank you,
Peter Wagner, Executive Director Donate
Can you help us sustain this work?
Thank you,
Peter Wagner, Executive Director Donate

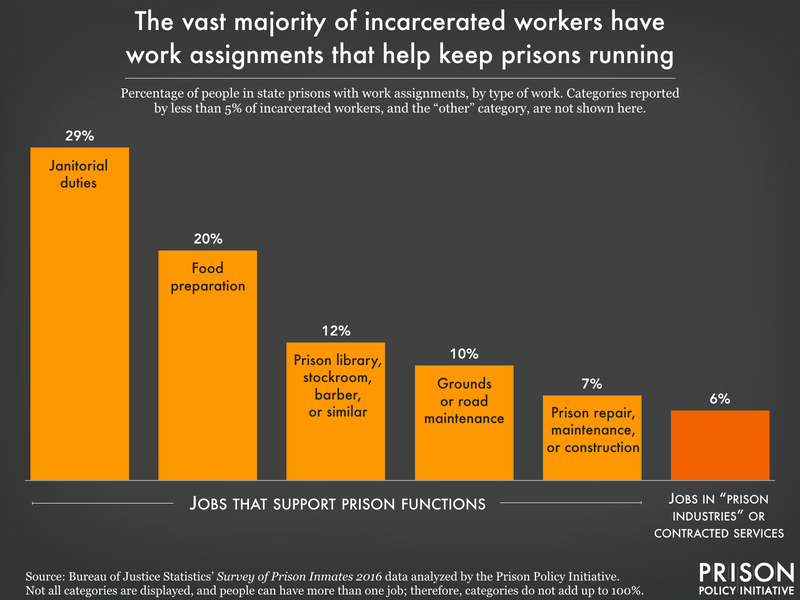
Data Source: Bureau of Justice Statistics' Survey of Prison Inmates, 2016 data analyzed by the Prison Policy Initiative. (Graph: Wendy Sawyer, 2022)
This graph originally appeared in The state prison experience: Too much drudgery, not enough opportunity.
Note that not all categories are displayed, and people can have more than one job; therefore, categories do not add up to 100%.


