One institution, two different views: How Black and White Americans regard the police
Year after year, Blacks consistently report having less confidence in the police than Whites.
by Rachel Gandy, July 2, 2015
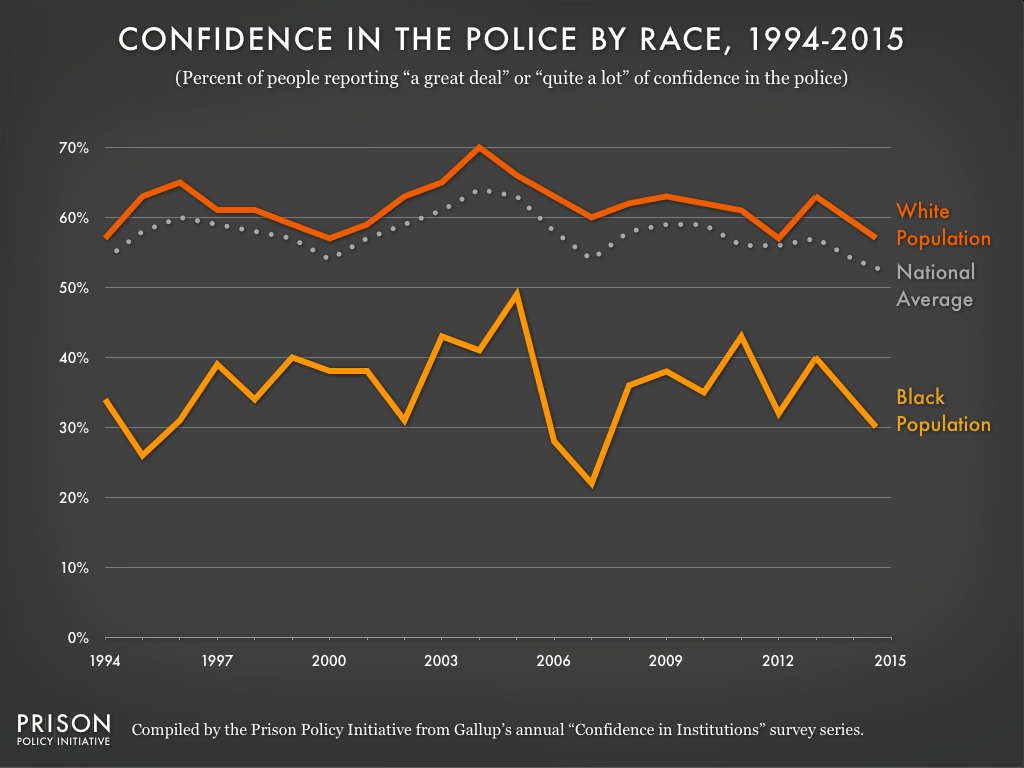
Last week, Gallup released an annual survey that revealed an alarming fact: American confidence in police has reached a 22-year low. In 2015, only 52% of Americans expressed “a great deal” or “quite a lot” of confidence in the police, tying with confidence levels reported in 1993 shortly after LA police officers brutally beat Rodney King. The most troubling part of the national average, however, isn’t evident until that statistic is broken down by race. Not only are Americans in general losing confidence in the police, but Black and White Americans have shown starkly different confidence levels for decades.
The differences between Black and White Americans in police confidence can be seen in the graph below:

White Americans have consistently expressed more positive attitudes about police than the average resident since Gallup began this particular poll. But while Whites consistently exceed the average police confidence level, Blacks consistently fall below it. In 2015, 57% of Whites reported “a great deal” or “quite a lot” of confidence in police, but only 30% of Blacks felt the same way. The difference between the two racial groups was greatest in 2007, when 60% of Whites and only 22% of Blacks expressed high levels of confidence in police.
The steady drop in police confidence since 2012 isn’t due to an increase in criminal behavior around the country. In fact, crime has been decreasing since its peak rate in 1991, so that today, crime rates are at historic lows. The decline in confidence in police isn’t a result of feeling unsafe around potential criminals; it’s a result of feeling unsafe around the police. Many communities today are protesting against police officers’ treatment of people of color, just like residents did after the 1991 Rodney King beating. Now, new names like Eric Garner, Michael Brown, Tamir Rice, and Freddie Gray are giving rise to national debates about what constitutes best police practices.
Police departments, however, are capable of changing these attitudes. For example, the Oakland Police Department, once called “the worst department in the country,” received 40% fewer complaints against officers in 2014 than it did the year prior. The reason for this decrease may be that, upon accepting his post in 2014, OPD’s chief Sean Whent decided to prioritize building trust in the community. Chief Whent told Politico, “In a democratic society, people have a say in how they are policed, and people are saying that they are not satisfied with how things are going.” Under Chief Whent’s leadership, the officers are experimenting with body cameras and new fieldwork practices in the hope that they will build the community’s confidence in the police department.
The lesson for other police departments is clear–you can change attitudes, but it will require a major shift in both priorities and practices first.
Note: One challenge with making the graph in this article was that, starting in 2013, Gallup began reporting their annual results as two-year averages (e.g., 2012-2013 and 2014-2015). We were able to calculate the 2013 single-year data point from the known 2012 single-year data and the reported 2012-2013 average. However, because as the 2013-2014 figure could not be located, we could not duplicate this technique for later years or show that particular two-year average. Therefore, our graph jumps from 2013 to the 2014-2015 average that we placed on the midpoint between 2014 and 2015.


