Hundreds are still jailed for technical parole violations in NYC, which means decarceration is happening far too slowly
As cities attempt to reduce their jail populations, they should pay attention to the lesson of NYC’s slow decarceration: Even releasing "low-level offenders" is a complicated process liable to be bogged down by delays.
by Wanda Bertram and Emily Widra, April 24, 2020
On March 21st, the Board of Correction of New York City recommended that the city decrease its in-custody population by at least 40%, or over 2,500 people.1 But a full month later, NYC has brought the jail population down from pre-pandemic levels by only 27%. And while NYC may be a model for cities that have done much less, like New Orleans, Miami, and St. Louis2, it is also a cautionary tale for doing so little. The infection rate on Rikers Island remains 5 times higher than that of New York City and over 7 times higher than that of New York State.

The city could bring down the infection rates in jails by releasing more people: A smaller jail population allows for physical space for social distancing and quarantining, reduces the burden on correctional healthcare staff, allows for accommodations for staff sick leave, and slows viral transmission both within the jail and to the community at large.
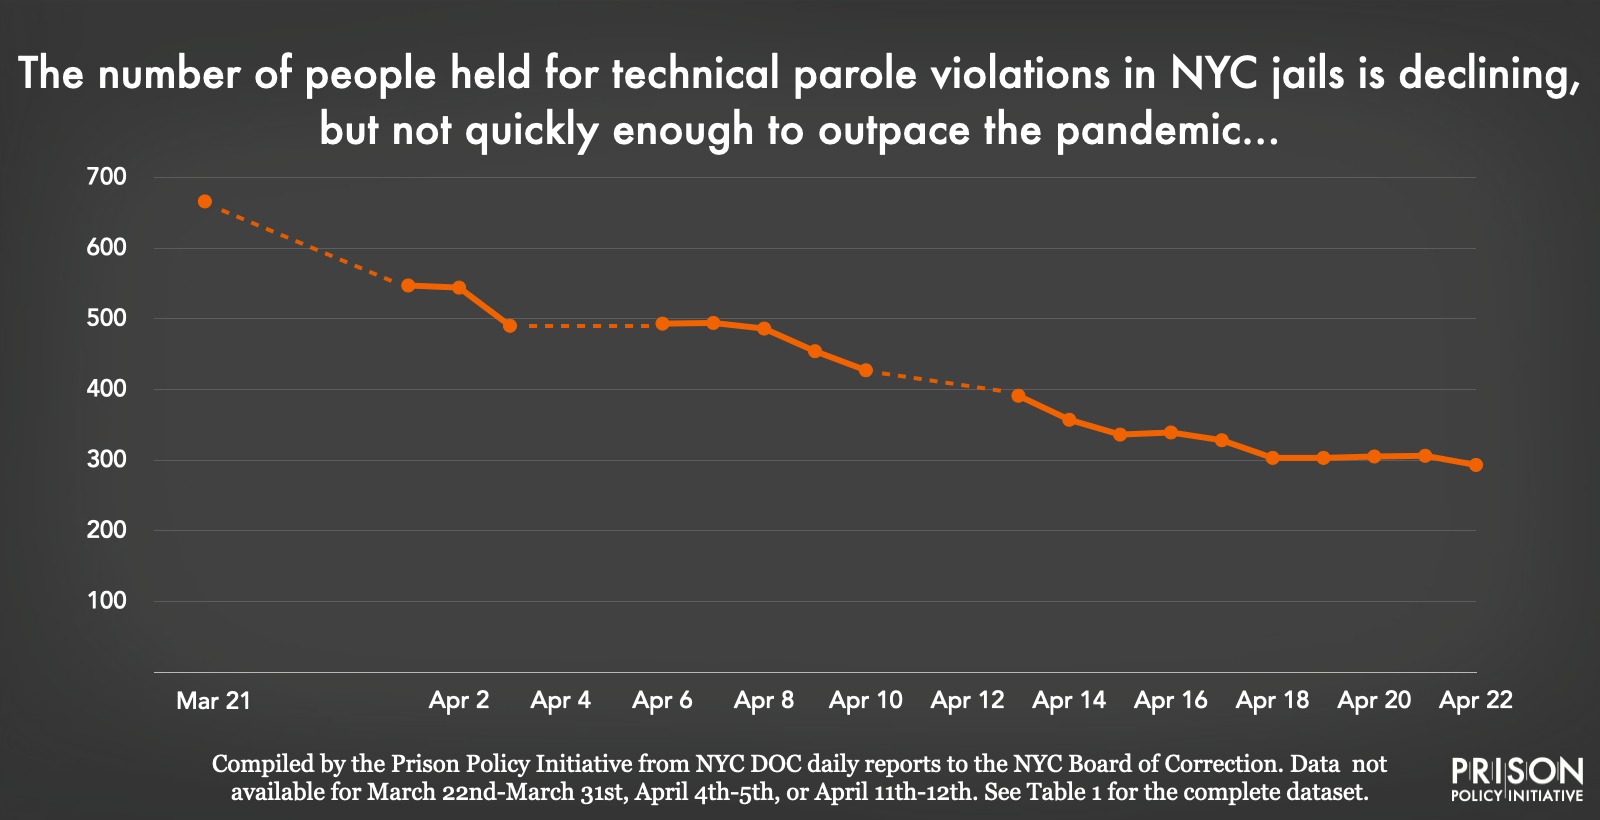
While all incarcerated people should be considered for release, it’s particularly shocking that NYC has been slow to release people held on “technical violations” of parole — that is, for infractions that are not even crimes. As of April 22nd, there were still 293 people held in NYC jails for technical parole violations:
| Date | Total held on a technical parole violation (with no open case) |
|---|---|
| Apr 22 | 293 |
| Apr 21 | 306 |
| Apr 20 | 305 |
| Apr 19 | 303 |
| Apr 18 | 303 |
| Apr 17 | 328 |
| Apr 16 | 339 |
| Apr 15 | 336 |
| Apr 14 | 357 |
| Apr 13 | 391 |
| Apr 12 | (no data, weekend) |
| Apr 11 | (no data, weekend) |
| Apr 10 | 427 |
| Apr 9 | 454 |
| Apr 8 | 486 |
| Apr 7 | 494 |
| Apr 6 | 493 |
| Apr 5 | (no data, weekend) |
| Apr 4 | (no data, weekend) |
| Apr 3 | 490 |
| Apr 2 | 544 |
| Apr 1 | 547 |
| Mar 22 – Mar 31 | (data not available) |
| Mar 21 | 666 |
There are a few reasons to be surprised by the number of people still jailed for technical violations in New York City. First is that it seems to run contrary to Governor Andrew Cuomo’s March 27 order that 1,100 people incarcerated for technical violations in New York state — including 600 in NYC jails alone — be considered for release. Second is that the city is facing significant pressure to release people held on technical violations, not only from community advocates, but from authorities within the parole system. (In early March, a coalition of current and former community supervision executives called for the nationwide suspension of arrests for technical probation and parole violations.)
It’s not clear who is responsible for holding up the release of people held on technical violations — city officials, state parole officials, judges, or some combination of the three. But what is clear is that this failure to act quickly will make it much harder to reduce the dangerous conditions in New York City jails, leading to more coronavirus infections and deaths. These deaths will disproportionately be people of color, who are overrepresented among technical parole violation detainees in the city’s jails.
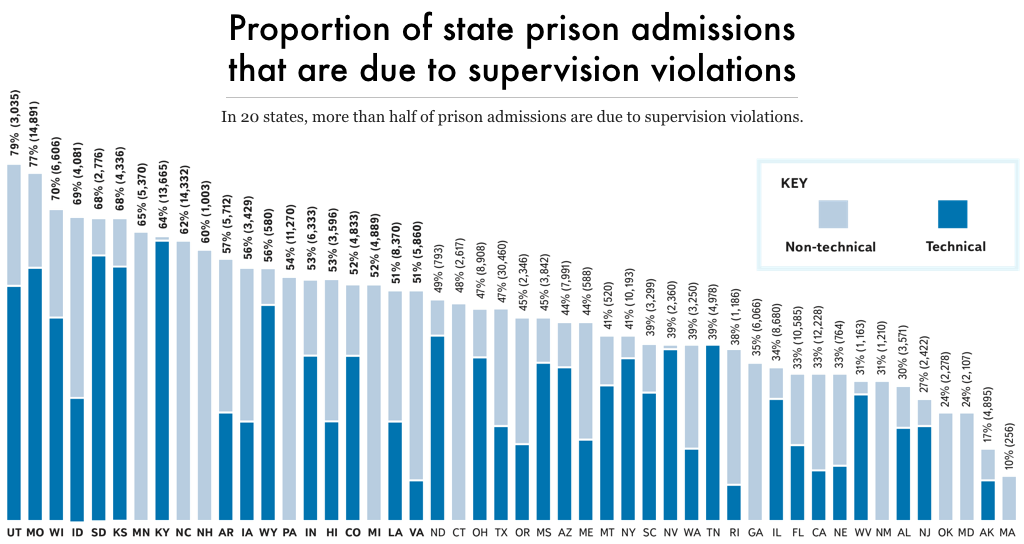
As we previously reported in Technical violations, immigration detainers, and other bad reasons to keep people in jail, technical violations account for a significant share of prison and jail populations across the country. A 2019 Council of State Governments report revealed that up to two-thirds of annual prison admissions in some states are for technical supervision violations, though these minor infractions involve no actual threat to any individual’s safety.
But as other state and local governments attempt to reduce the number of people held for these minor violations, they should pay attention to the lesson of NYC’s slow decarceration: Even releasing “low-level offenders” is a complicated process liable to be bogged down by delays. State parole officials, city correctional leaders, judges, prosecutors, and other decisionmakers all must cooperate in order for hundreds or thousands of people to be released in a short time frame. During a pandemic, any of these officials holding up the release process will mean more deaths.

Footnotes
-
The NYC Board of Correction recommended over 2,500 people be reviewed for release in a March 21st letter to the city’s district attorneys and chief judge, the NYC DOC, and the NYS DOCCS. According to the Vera Institute for Justice, the NYC jail system held a total of 5,447 people on February 29th, 2020.
-
The table below shows the population reductions of the largest jails in the U.S. (those with pre-pandemic populations of over 500 people). This table was compiled using the Vera Institute for Justice’s jail population tool. Of note, we only compared large jails with pre-pandemic population data from January and February 2020.
County City Date of Baseline Jail Population Date of Latest Jail Population Pre-COVID-19 Jail Population Jail Population (Latest) Jail Population Change (percent) San Francisco, CA San Francisco 1/21/20 4/5/20 1,238 766 -38% Oakland, MI Pontiac 2/29/20 4/21/20 1,282 805 -37% Wayne, MI Detroit 2/29/20 4/20/20 1,410 915 -35% Marion, IN Indianapolis 2/28/20 4/21/20 1,987 1,302 -34% Fayette, KY Lexington 2/27/20 4/16/20 1,189 807 -32% Salt Lake, UT Salt Lake City 2/29/20 4/20/20 2,096 1,432 -32% Allegheny, PA Pittsburgh 2/29/20 4/8/20 2,488 1,714 -31% Jefferson, KY Louisville 2/27/20 4/16/20 1,864 1,290 -31% Lafayette, LA Lafayette 2/29/20 4/20/20 960 680 -29% Bell, TX Belton 2/29/20 4/20/20 878 628 -28% Los Angeles, CA Los Angeles 2/29/20 4/20/20 17,076 12,269 -28% New York City, NY New York City 2/29/20 4/21/20 5,447 3,976 -27% Santa Clara, CA San Jose 2/29/20 4/20/20 3,219 2,362 -27% Bartow, GA Cartersville 2/29/20 4/21/20 680 504 -26% Daviess, KY Owensboro 2/28/20 4/21/20 709 524 -26% King, WA Seattle 2/29/20 4/20/20 2,130 1,581 -26% Cook, IL Chicago 2/29/20 4/20/20 5,555 4,235 -24% Orleans, LA New Orleans 2/29/20 4/20/20 1,052 803 -24% Bucks, PA Doylestown 2/28/20 4/8/20 952 734 -23% Christian, KY Hopkinsville 2/27/20 4/21/20 770 591 -23% Calcasieu, LA Lake Charles 2/29/20 4/20/20 1,261 987 -22% Okaloosa, FL Crestview 1/31/20 4/21/20 679 529 -22% Jefferson, AL Birmingham 2/29/20 4/20/20 996 782 -21% Warren, KY Bowling Green 2/29/20 4/21/20 668 525 -21% Alachua, FL Gainesville 2/29/20 4/20/20 724 578 -20% Dauphin, PA Harrisburg 2/29/20 4/21/20 1,117 899 -20% Forsyth, NC Winston-Salem 2/28/20 4/21/20 817 652 -20% Guilford, NC Greensboro 2/28/20 4/21/20 1,025 822 -20% Hardin, KY Elizabethtown 2/28/20 4/21/20 766 610 -20% Lafourche, LA Thibodaux 2/29/20 4/20/20 637 511 -20% Lehigh, PA Allentown 2/28/20 4/8/20 734 586 -20% St. Tammany, LA Covington 2/29/20 4/20/20 937 752 -20% Virginia Beach city, VA Virginia Beach 2/29/20 4/20/20 1,518 1,219 -20% Will, IL Joliet 2/29/20 4/21/20 696 557 -20% Livingston, LA Livingston 2/29/20 4/20/20 956 773 -19% Suffolk, NY Riverhead (Long Island) 2/29/20 4/10/20 695 560 -19% East Baton Rouge, LA Baton Rouge 2/29/20 4/20/20 1,683 1,374 -18% Caddo, LA Shreveport 2/29/20 4/20/20 1,289 1,069 -17% Merced, CA Merced 2/29/20 4/20/20 799 661 -17% Brown, WI Green Bay 2/29/20 4/20/20 733 614 -16% Hopewell city, VA Hopewell 2/29/20 4/20/20 1,407 1,183 -16% Jefferson, LA Gretna 2/29/20 4/20/20 1,093 921 -16% Miami-Dade, FL Miami 1/31/20 4/3/20 4,034 3,400 -16% Prince George’s, MD Upper Marlboro 2/29/20 4/21/20 866 724 -16% St. Louis city, MO St. Louis 2/29/20 4/5/20 883 739 -16% Staunton city, VA Staunton 2/29/20 4/20/20 904 766 -15% Lancaster, PA Lancaster 2/28/20 4/8/20 774 669 -14% Nassau, NY Mineola 2/29/20 4/10/20 733 632 -14% Ouachita, LA Monroe 2/29/20 4/20/20 1,195 1,024 -14% Rapides, LA Alexandria 2/29/20 4/20/20 848 733 -14% Roanoke, VA Salem 2/29/20 4/20/20 935 801 -14% Claiborne, LA Homer 2/29/20 4/20/20 579 506 -13% Wake, NC Raleigh 2/28/20 4/21/20 1,227 1,072 -13% Washington, VA Abingdon 2/29/20 4/20/20 1,997 1,745 -13% Franklin, LA Winnsboro 2/29/20 4/20/20 822 729 -11% Webster, LA Minden 2/29/20 4/20/20 638 567 -11% Richland, LA Rayville 2/29/20 4/20/20 741 673 -9% Grayson, KY Leitchfield 2/27/20 4/16/20 620 571 -8% Plaquemines, LA Pointe a la Hache 2/29/20 4/20/20 615 565 -8% Caldwell, LA Columbia 2/29/20 4/20/20 608 565 -7% Erie, NY Buffalo 2/29/20 3/31/20 654 606 -7% Suffolk city, VA Suffolk 2/29/20 4/20/20 800 743 -7% Bowie, TX Texarkana 2/1/20 3/29/20 740 698 -6% Laurel, KY London 2/28/20 4/21/20 609 574 -6% Onondaga, NY Syracuse 2/29/20 3/31/20 600 577 -4% Monroe, NY Rochester 2/29/20 3/31/20 701 690 -2% Bossier, LA Bossier 2/29/20 4/20/20 1,078 1,102 2% Chesapeake city, VA Chesapeake 2/29/20 4/8/20 1,025 1,046 2% Yazoo, MS Yazoo City 2/28/20 4/21/20 522 536 3%


