New data reveals where people in New York prisons come from
Report shows every community is harmed by mass incarceration, particularly in upstate New York
June 6, 2022
Today, the Prison Policy Initiative and VOCAL-NY released a new report, Where people in prison come from: The geography of mass incarceration in New York, that gives an in-depth look at where people in New York state prisons come from. The report also provides 13 detailed data tables — including neighborhood-specific data for New York City, Buffalo, Syracuse, and Yonkers — that serve as a foundation for advocates, organizers, policymakers, data journalists, academics, and others to do their own analysis of how incarceration relates to other factors of community well-being.
The report shows:
- Every single county — and every Assembly and Senate district — is missing a portion of its population to incarceration in state prison;
- Upstate communities, including some of the least populous counties, have disproportionately high state prison incarceration rates; and
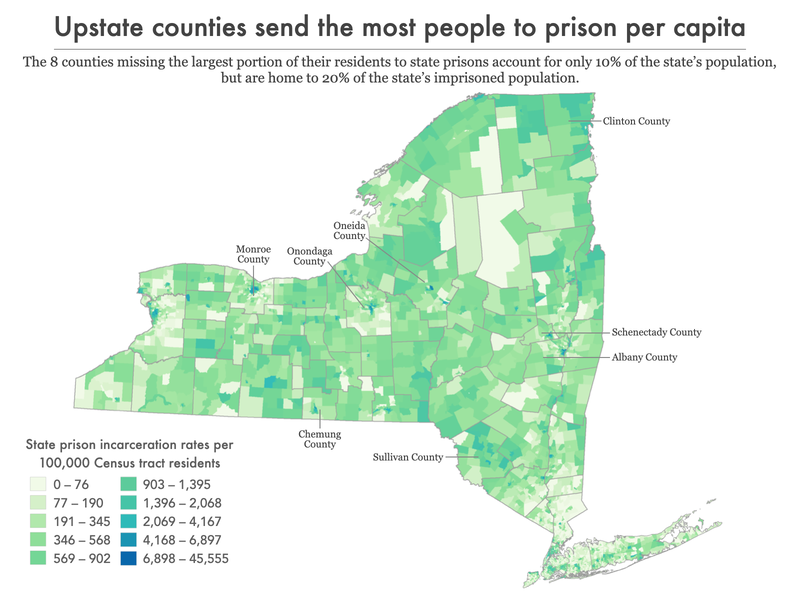
- The worst impacts of mass incarceration are often concentrated in specific neighborhoods that are already systematically under-resourced. For example, more than a quarter of everyone in state prison from Syracuse comes from just 4 of that city’s 32 neighborhoods.
Data tables included in the report provide residence information for people in New York State prisons at the time of the 2020 Census, offering the clearest look ever at which communities are most impacted by mass incarceration. They break down the number of people locked up by county, city, town, zip code, legislative district, census tract, and other areas.
The data show the six counties with the highest state prison incarceration rates are upstate: Schenectady, Albany, Monroe (Rochester), Oneida (Utica), and Onondaga (Syracuse). Additionally, New York City had a state imprisonment rate below the state average, more than five times lower than Rochester, and more than four times lower than Syracuse and Albany.

“The nation’s 40-year failed experiment with mass incarceration harms each and every one of us. This analysis shows that while some communities are disproportionately impacted by this failed policy, nobody escapes the damage it causes,” said Emily Widra, Senior Research Analyst at the Prison Policy Initiative. “Our report is just the beginning. We’re making this data available so others can further examine how geographic incarceration trends correlate with other problems communities face.”
The report also highlights other studies that show a correction between areas in the state with high incarceration rates and a wide range of negative consequences, including lower life expectancy, increased rates of asthma (including in children), and lower standardized test scores.
“This data allows us better understand the full scale of the devastation mass incarceration has brought to communities across New York,” said Nick Encalada-Malinowski, of VOCAL-NY. “More importantly though, it can be used as a roadmap for leaders who are committed to breaking the cycle of incarceration by investing in the communities that need it most.”
The data and report are made possible by the state’s landmark 2010 law that requires that people in prison be counted as residents of their hometown rather than in prison cells when state and local governments redistrict every ten years. New York was among the first states in the nation to end the practice of “prison gerrymandering,” which gave disproportional political clout to state and local districts that contain prisons at the expense of all of the other areas of the state. Since then, more than a dozen states and 200 local governments have taken steps to end the practices. In total, roughly half the country now lives in a place that has taken action to address prison gerrymandering.


