Data Source: U.S. Census 2010, Summary File 1. (Graph: Leah Sakala, May 2014)
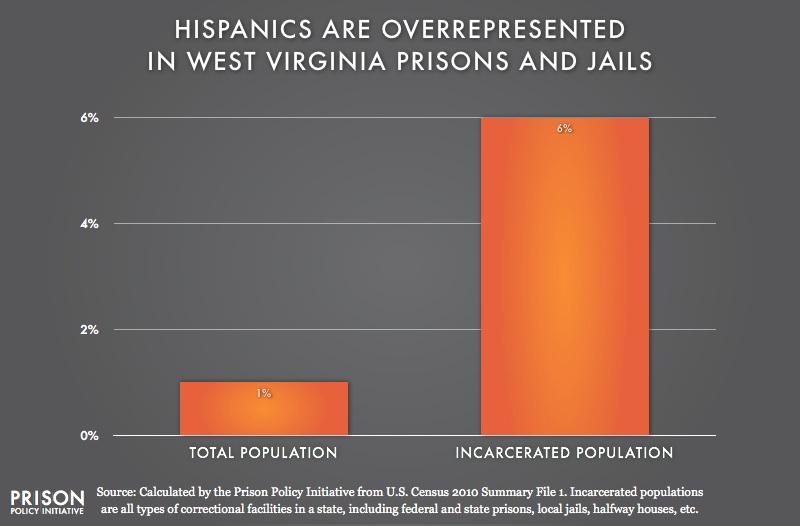
This graph uses U.S. Census data for all people incarcerated in the state, including people in federal and state prisons, local jails, halfway houses, etc. While state and local facilities contain people processed by the West Virginia judicial systems, the federal prisons contain people sent to those facilities by courts all over the country.
For our purposes, the fact that federal prison populations are included in the Census Bureau's data as residents of West Virginia would be an unimportant statistical quirk except for that fact that there are so many federal prisons in West Virginia. In fact, slightly more than half of the incarcerated people that the Census counted in West Virginia were in a federal prison. This has a dramatic impact of the demographics of the incarcerated population. Of the 1,021 incarcerated Hispanics the Census counted in West Virginia, 942 (92%) were in the federal prison and 79 (8%) were incarcerated in all other facilities.
 This graph is a part of Breaking Down Mass Incarceration in the 2010 Census: State-by-State Incarceration Rates by Race/Ethnicity, a Prison Policy Initiative briefing.


