HELP US END MASS INCARCERATION
The Prison Policy Initiative uses research, advocacy, and organizing to dismantle mass incarceration. We’ve been in this movement for 23 years, thanks to individual donors like you.
Can you help us sustain this work?
Thank you,
Peter Wagner, Executive Director Donate
Can you help us sustain this work?
Thank you,
Peter Wagner, Executive Director Donate

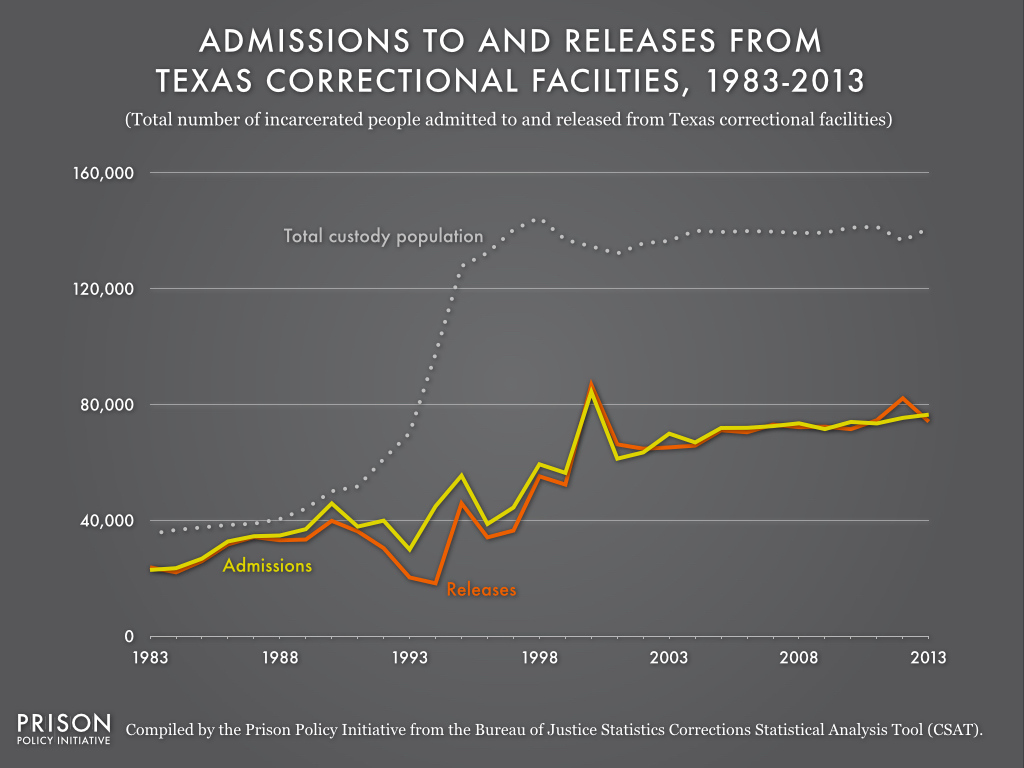
Data Source: Compiled by the Prison Policy Initiative from the Bureau of Justice Statistics Corrections Statistical Analysis Tool (CSAT). (Graph: Rachel Gandy, 2015)
This graph originally appeared in Explaining Texas’ overnight prison boom.
Beginning in 1993, the number of releases from Texas prisons fell behind the number of admissions, allowing the state’s total custody population to rise sharply for the next five years. Once release counts rose again to match admission counts, Texas’ total custody population leveled off and remained stagnant. These patterns show that admissions to and releases from prisons serve as at least one driving force behind rapidly changing prison populations.


