Data Source: Please refer to “State Data” portion of original report. (Graph: Joshua Aiken, 2017)
This graph originally appeared in Era of Mass Expansion: Why State Officials Should Fight Jail Growth.
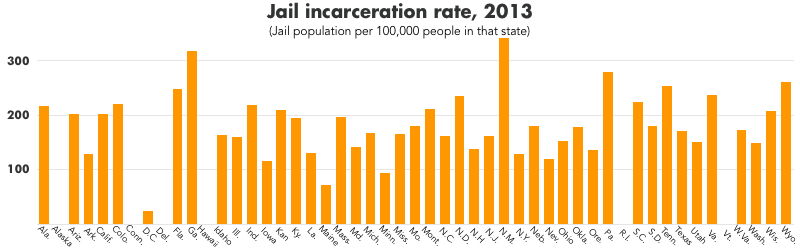
To allow meaningful comparisons between states of how frequently local officials use jails to incarcerate people pre-trial or for minor (typically misdemeanor) offenses, this chart shows the jail population in each state per 100,000 people in that state. This chart does not include any people physically present in jails who are held for federal or state agencies.


