HELP US END MASS INCARCERATION
The Prison Policy Initiative uses research, advocacy, and organizing to dismantle mass incarceration. We’ve been in this movement for 23 years, thanks to individual donors like you.
Can you help us sustain this work?
Thank you,
Peter Wagner, Executive Director Donate
Can you help us sustain this work?
Thank you,
Peter Wagner, Executive Director Donate

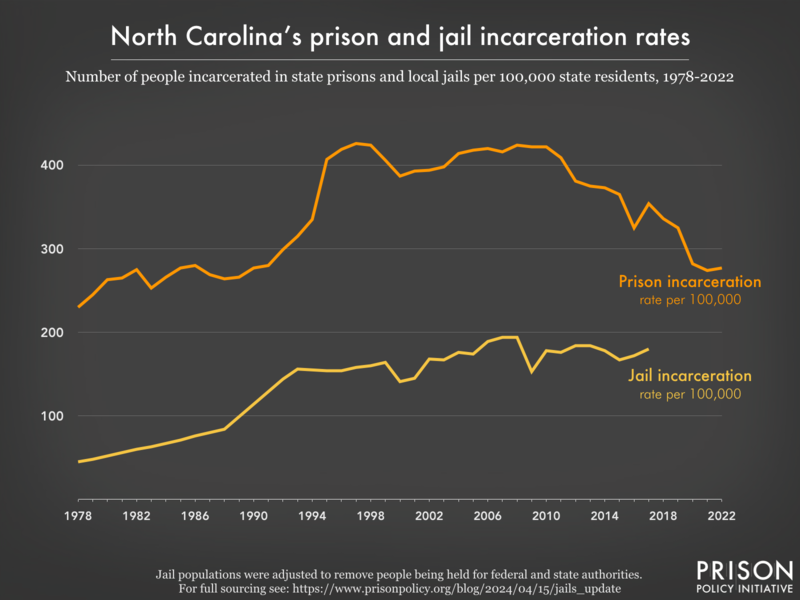
(Graph: Emily Widra, April 2024)
This graph is a part of New data and visualizations spotlight states' reliance on excessive jailing, published in April 2024. For more research and graphs about North Carolina, see our North Carolina state profile.


