HELP US END MASS INCARCERATION
The Prison Policy Initiative uses research, advocacy, and organizing to dismantle mass incarceration. We’ve been in this movement for 23 years, thanks to individual donors like you.
Can you help us sustain this work?
Thank you,
Peter Wagner, Executive Director Donate
Can you help us sustain this work?
Thank you,
Peter Wagner, Executive Director Donate

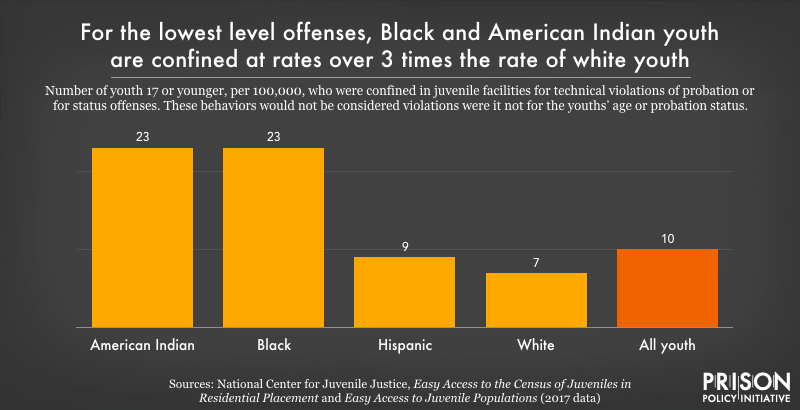
Data Source: National Center for Juvenile Justice, Easy Access to the Census of Juveniles in Residential Placement and Easy Access to Juvenile Populations (2017 data). (Graph: Wendy Sawyer, 2020)
This graph originally appeared in Visualizing the racial disparities in mass incarceration.


