HELP US END MASS INCARCERATION
The Prison Policy Initiative uses research, advocacy, and organizing to dismantle mass incarceration. We’ve been in this movement for 24 years, thanks to individual donors like you.
Can you help us sustain this work?
Thank you,
Peter Wagner, Executive Director Donate
Can you help us sustain this work?
Thank you,
Peter Wagner, Executive Director Donate
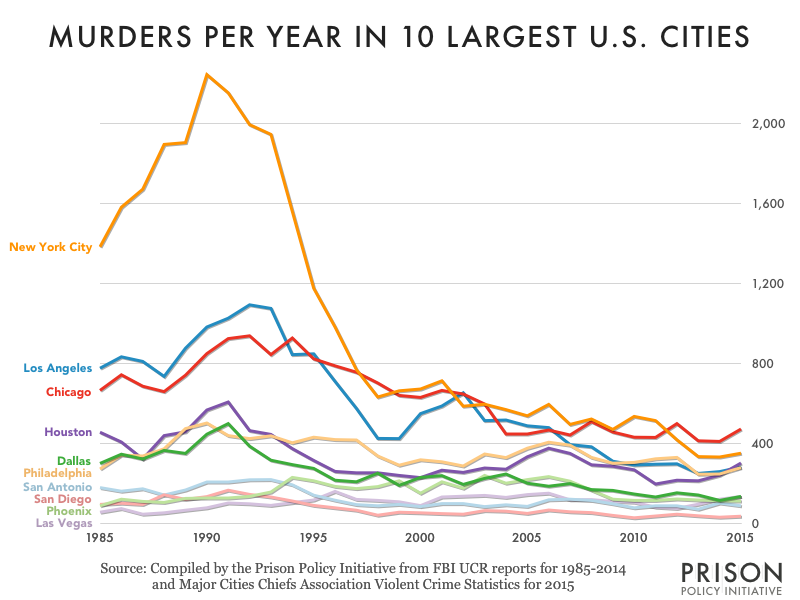
Data Source: Compiled by the Prison Policy Initiative from FBI UCR reports for 1985-2014 and Major Cities Association Violent Crime Statistics for 2015. (Graph: Wendy Sawyer, 2016)
This graph originally appeared in Making a mountain out of a molehill: murder rate analysis.
For most cities, murder is much lower now than during the 1980s or 1990s. The data for 1985-2014 comes from the FBI. The FBI has not published the 2015 full year data yet, so I relied on data from the Major Cities Chiefs Association, which historically is very similar if slightly higher than the FBI’s figures. For that reason, this graph may overstate the increase in murder in 2015 in these cities.


