HELP US END MASS INCARCERATION
The Prison Policy Initiative uses research, advocacy, and organizing to dismantle mass incarceration. We’ve been in this movement for 23 years, thanks to individual donors like you.
Can you help us sustain this work?
Thank you,
Peter Wagner, Executive Director Donate
Can you help us sustain this work?
Thank you,
Peter Wagner, Executive Director Donate

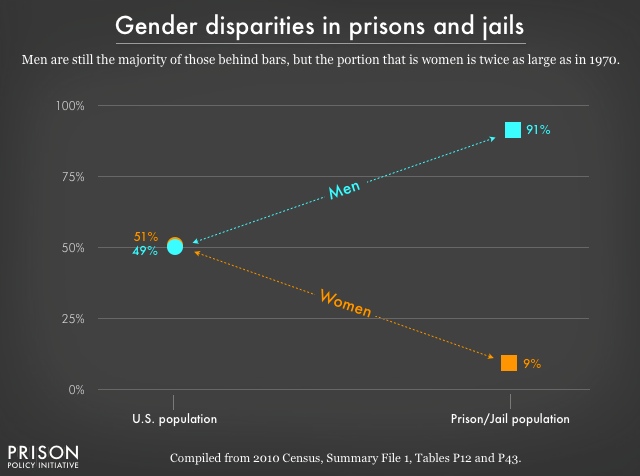
Data Source: Compiled from 2010 Census, Summary File 1, Tables P12 & P43. (Graph: Peter Wagner & Bernadette Rabuy, 2016)
This graph originally appeared in Mass Incarceration: The Whole Pie 2016.
Chart comparing the gender distribution of the total U.S. population with that of the incarcerated population. Men are almost half of the total U.S. population, but are a majority (91%) of the incarcerated population. Women are just 9% of the incarcerated population, but this portion has doubled since 1970.


