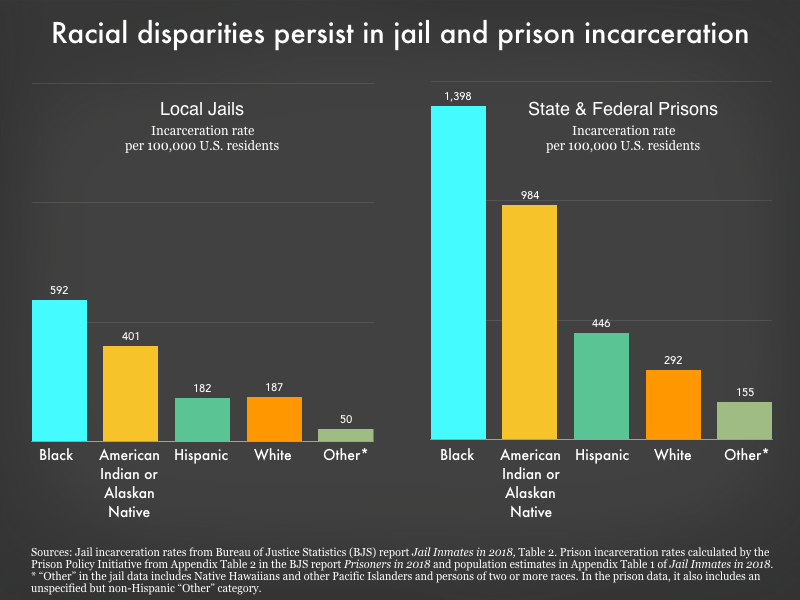
Data Source: Jail incarceration from Bureau of Justice Statistics (BJS) report Jail Inmates in 2018, Table 2. Prison Incarceration rates calculated by the Prison Policy Initiative from Appendix Table 2 in the BJS report Prisoners In 2018. "Other" in the jail data includes Native Hawaiians and other Pacific Islanders and persons of two or more races. In prison data, it also includes an unspecified but non-Hispanic "Other" category. (Graph: Wendy Sawyer, 2020)
This graph originally appeared in While jails drastically cut populations, state prisons have released almost no one.
Events
- April 30, 2025:
On Wednesday, April 30th, at noon Eastern, Communications Strategist Wanda Bertram will take part in a panel discussion with The Center for Just Journalism on the 100th day of the second Trump administration. They’ll discuss the impacts the administration has had on criminal legal policy and issues that have flown under the radar. Register here.
Not near you?
Invite us to your city, college or organization.


