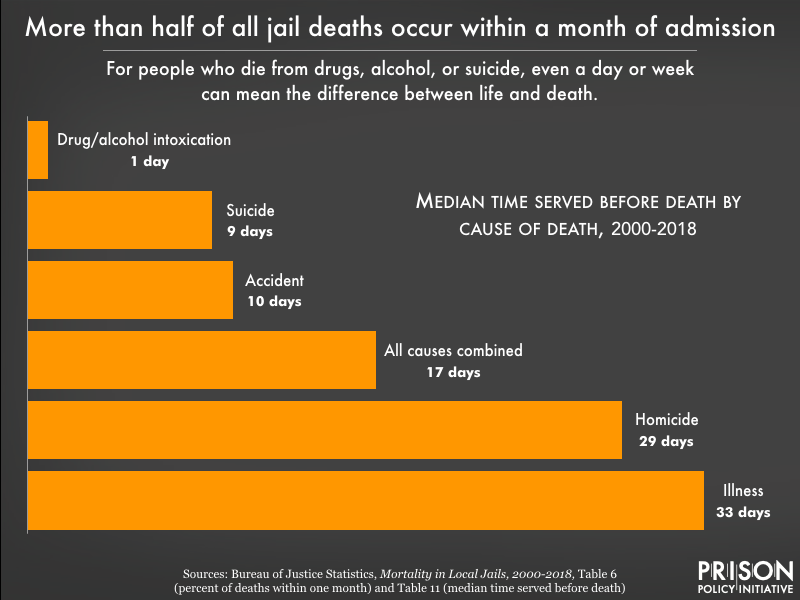
Data Source: Source: Bureau of Justice Statistics, Mortality in Local Jails, 2000-2018, Table 6 (percent of deaths within one month) and Table 11 (median time served before death). (Graph: Wendy Sawyer, 2021)
This graph originally appeared in Rise in jail deaths is especially troubling as jail populations become more rural and more female.
Events
- August 5, 2024:
On Wednesday, August 5, 2024, at 3 PM EST, we’ll host a panel of advocates to discuss the importance and challenges of helping people in prison testify at legislative hearings, and introduce our new legislative testimony toolkit.
Panelists include: Anthony Blakenship of Civil Survival, Jesse White of Prisoners’ Legal Services of Massachusetts, and incarcerated journalist Christopher Blackwell.
Register here.
Not near you?
Invite us to your city, college or organization.


