Jim Crow in Massachusetts?
Prisoner disenfranchisement
By Peter Wagner
October 31, 2004
Press release
Massachusetts amended its constitution in 2000 to deny prisoners the right to vote. Out of a population of 4.9 million people of voting age, the amendment affects less than 15,000 people. But it creates a stark racial disparity that was likely not intended by the voters.
Almost 1.5% of Black adults in Massachusetts are disenfranchised. This is 6 times the rate for White adults. Over 3% of Black men are disenfranchised in Massachusetts. Blacks are only 5.5% of Massachusetts citizens, but are 29% of the state's disenfranchised. Latinos are 6.8% of the state, but are almost 24% of those barred from the polls.
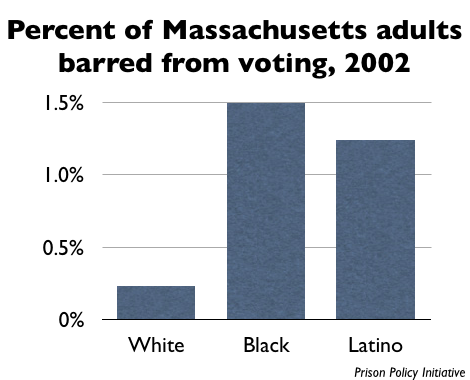
Figure 1. Percent of Massachusetts adults barred from voting, 2002.
Massachusetts amended the state constitution in November 2000 to bar prisoners from voting. This was the first time the constitution was amended to take away rights from a group. Prior to disenfranchisement, few prisoners actually voted. The impetus for the Amendment was an attempt by prisoners to organize a Political Action Committee to defeat then-Governor Paul Cellucci. Prisoners and their families are among the poorest residents in the state, so it is difficult to see the PAC as a credible threat to the governor. The Amendment passed the legislature and a public referendum without receiving much public debate on either side.
Although the number of people subject to disenfranchisement in Massachusetts is small, the implications are large. The 2000 election and recent partisan gerrymandering controversies have damaged the public's view of the link between voter participation and democratic representation. The creation of a new disenfranchisement scheme in 2000 makes matters worse because it tells the communities that have suffered historic exclusion from the ballot box that they are, in fact, still not welcome.
In an era where the right to vote is continually being expanded, that surely can not be the message that Massachusetts intended to send to its citizens.
Tables
| Disenfranchised women | Disenfranchised men | Disenfranchised people | |
|---|---|---|---|
| White | 611 | 9,646 | 10,257 |
| Black or African American | 178 | 4,154 | 4,332 |
| Hispanic or Latino | 174 | 3,412 | 3,586 |
| Asian | 2 | 109 | 111 |
| American Indian or Alaska Native | 1 | 42 | 43 |
| Native Hawaiian or Pacific Islander | 0 | 2 | 2 |
| Other/unknown | 7 | 147 | 154 |
| Total | 799 | 14,094 | 14,893 |
| Disenfranchised population | Massachusetts population | |
|---|---|---|
| White | 68.87% | 86.53% |
| Black or African-American | 29.09% | 5.54% |
| Hispanic or Latino | 24.08% | 6.75% |
| Percentage of adults disenfranchised | Percentage of adult males disenfranchised | |
|---|---|---|
| White | 0.23% | 0.47% |
| Black or African American | 1.49% | 3.06% |
| Hispanic or Latino | 1.24% | 2.43% |
| Total | 0.30% | 0.61% |
About the author
Peter Wagner is Assistant Director of the Prison Policy Initiative, an Open Society Institute Soros Justice Fellow, and a 2003 graduate of the Western New England College School of Law.
Acknowledgements
This research was supported by a grant from the Soros Justice Fellowship Program of the Open Society Institute. Marty Rosenthal, Rebecca Young, Peter Costanza and Alec Ewald provided invaluable encouragement, research assistance and feedback. Responsibility for the methodology and any errors that may have resulted reside solely with the author.
About the Prison Policy Initiative
The Prison Policy Initiative (PPI) conducts research and advocacy on incarceration policy. Its work starts with the idea that the racial, gender and economic disparities between the prison population and the larger society represent the grounds for a democratic catastrophe. PPI's concept of prison reform is based not only in opposition to a rising rate of incarceration, but in the search for a lasting solution to pressing social problems superior to temporarily warehousing our citizens in prisons and jails.
The Prison Policy Initiative is based in Northampton, Massachusetts. For more information about PPI or prison policy in general, visit http://www.prisonpolicy.org.
Sources and methodology
Article of Amendment CXX of the Massachusetts Constitution bars from voting "persons who are incarcerated in a correctional facility due to a felony conviction" and this report draws on a variety of sources to identify this population.
Demographics of Massachusetts prisoners in state correctional facilities were drawn from Massachusetts Department of Correction, "January 1, 2002 Inmate Statistics", tables 1 and 2. The state population for January 1, 2002 was calculated by averaging the Census Bureau estimates for July 1, 2001 and July 1, 2002. Voting age populations were calculated by applying the percentage of each racial and gender group that was over the age of 18 as reported by Census 2000 to the January 1, 2002 estimates.
Making the analysis more complicated is the fact that Massachusetts also incarcerates many felons with short sentences in county Houses of Correction, which have a different record keeping system.
Because the only publicly available data on House of Corrections population by race, ethnicity, gender and crime type is "New Court Commitments to Massachusetts County Correctional Facilities During 2002", we converted this commitment data to population data using a series of assumptions that understate our results on the magnitude of and racial disparity within Massachusetts' felon disenfranchisement scheme. We assumed that all House of Corrections commitments were evenly distributed by race, gender and sentence length. Procedurally, we reduced the number of commitments by 31% to match the House of Corrections population reported in the "Quarterly Report on the Status of Prison Overcrowding, First Quarter of 2002". We reduced this dataset a further 51% to remove those committed to a House of Corrections for a misdemeanor.
Finally, the state statistics comply with the Federal OMB guidelines and count Hispanics as an ethnicity that may be of any race, while county statistics count Hispanics as a race. In order to make the county statistics compatible with the state statistics, we applied the proportions seen in the state report that 16% of Hispanics incarcerated in Massachusetts are Black and 84% are White to the Hispanic populations in the county statistics. As a result, a Black Hispanic was therefore counted once in comparison to the state population, but will be represented both in this report's statistics for Blacks and for Hispanics.
Recommended Reading:

50 state incarceration profiles
All of our recent reports about prison/jail growth, racial disparities, and more, re-organized by state.

Research Library
We curate a searchable database of 4,000+ original research reports, organizing each entry by topic and adding brief summaries.

Mass Incarceration: The Whole Pie
The U.S. incarcerates nearly 2 million people. Where are they locked up and why? Read our report.

Bad Behavior
This national report explains how prison disciplinary policies manufacture misconduct and severly punish incarcerated people.