A how-to guide: Critically reviewing a jail assessment calling for a bigger jail
- Table of Contents
- What assumptions did the authors make?
- Whose opinions did they consider?
- What do the numbers really say?
- Who is being jailed that shouldn’t be?
- What services are moving out of the community and into the jail?
- Other resources
- Glossary
Counties across the country are regularly discussing or advancing plans to expand existing jails or build new facilities to increase their capacity to incarcerate more people. Jail assessments (sometimes referred to as “justice system assessments,” “needs assessments,” “master plans,” or “feasibility studies”) have become a core part of these discussions and decisions. Jail assessments are analyses, often conducted by private companies who have been hired by a county, to analyze the operations of the current jail and make recommendations for building a new jail or expanding an existing one. The assessments can be dense: hundreds of pages in length with graphs, discussions of statistical models, and the use of multiple terms of art. But community members should not be deterred from reading these documents with a critical eye: these reports often have obvious flaws or even provide data that supports arguments against building a bigger jail.
The Prison Policy Initiative has supported multiple groups organizing against county efforts to create more jail space, often reviewing and providing feedback on the county’s jail assessment. While we are always happy to be contacted with such a request, we put together this guide to help local advocates and decisionmakers identify some of the questions that can be helpful to consider when reviewing a jail assessment (and included sidebars with some extra tips for combatting jail expansion efforts). Here’s what to look for:
What assumptions did the authors make?
Jail assessments commonly assume that the local criminal legal system is operating at peak efficiency and include presumptions that skew numbers upwards, in support of ever-larger jails. For example, assessments often explicitly state that it is assumed there will be no change to the status quo, even when reforms that could reduce incarceration are being seriously considered at the local or state level or have already passed:


No analysis is provided of the impact proposed reforms will have on incarceration rates. What is even more troubling is that these assessments sometimes fail to take into account or even discuss the impact reforms that have already passed will have on incarceration numbers. We saw this in Otsego County, Michigan, as discussed in our publication Smoke and mirrors: A cautionary tale for counties considering a big, costly new jail.
In Otsego County, the jail assessment discussed how “over 1,100 outstanding warrants” and the rise in drug cases contributed to the need for a bigger jail. However, the assessment failed to acknowledge that:
- many of the warrants were for underlying offenses that, based on recent changes in Michigan law, were no longer criminal or jailable, and thus unlikely to lead to actual jail time; and
- the drug cases referenced were brought before Michigan legalized recreational marijuana use, possession, and licensed sale, and a significant number of the cases referenced involved marijuana.

In addition, jail assessments occasionally discuss the need for rolling back reforms that have reduced incarceration rates. This may be the case when the county has been more successful at adopting reforms — such as cite and release — than its neighboring counties, as was the case in Benton County, Oregon. In Benton County, law enforcement argued that citation and release should be used in 18-23 percent fewer cases, ostensibly only because this successful strategy is used less in other places:

It is important to note that “[f]inalizing jail bed need forecasts is more a matter of policy than of statistics.” This fact, recognized in a 2019 Cortland County, New York assessment, also underscores the need for jail assessments to consider “alternative policies, programs, and practices” that could reduce incarceration. The impact of policy decisions on jail planning is also reflected in the “systems approach” recommended by the U.S. Department of Justice’s National Institute of Corrections. A “systems approach” looks at how the different parts of the criminal legal system impact jail populations, instead of focusing on those populations alone. This approach considers laws that determine what offenses are “jailable” as well as decisions made by various actors in the criminal legal system — law enforcement, prosecutors, judges, magistrates, court systems, and jail administrators — that impact pretrial release, charging, processing, and sentencing. After all, each of these elements has a direct bearing on how many people are incarcerated.
When looking at the presumptions authors have made in a jail assessment, be sure to ask:
- Does the assessment assume no changes in law or policy will be made in the next several decades that could reduce the jail population?
- Have laws or policies been changed that will affect the jail population, but which the assessment is not discussing or accounting for?
- Are changes in laws or policies being advanced that would reduce incarceration rates, but which are not being accounted for?
- Is the assessment advocating for more beds based on the presumption that certain policies or practices that have reduced incarceration numbers should be scaled back or reversed? What supporting evidence or details do they offer? Are these valid?
- Is the assessment examining actions criminal legal system actors (i.e., law enforcement, judges, prosecutors, jail administrators) can take to reduce incarceration rates?
Whose opinions did the authors consider?
Various “stakeholders” are consulted in the jail assessment process to understand how the local criminal legal system operates and help set recommendations. However, it is important to check which stakeholders were consulted. More often than not, the only “stakeholders” assessment authors have spoken to are those who work within the current criminal legal system — i.e., police, sheriffs, jail administrators, district attorneys, judges, coordinators at special courts, and community corrections officials — and the opinions of these individuals have sometimes been used to recommend more beds to a facility than would follow from the data “analysis,” as was the case in Otsego County. Sometimes individuals working in health care and housing are also included; however, individuals from overpoliced communities, community advocates, and individuals who have experienced incarceration and their family members are rarely included in stakeholder discussions.

When looking at the stakeholder input process, it’s important to consider:
- Who was consulted?
- Whose voices were missing from the process?
- How do the stakeholders consulted balance each other out?
- For example, is there a reasonable split between citizens, directly impacted individuals, criminal legal system actors, and other relevant service providers (i.e., mental health and substance use treatment providers)?
- What weight was given to the input provided by different stakeholders?
What do the numbers really say?
While you might expect that the numbers and graphs used in jail assessments would provide a clear, unbiased view of incarceration trends and needs, this is often not the case. For example, the range of years included in the analysis can impact whether the report indicates there is an upward or downward incarceration trend, and it’s all too easy for consultants to cherry-pick the data that supports a bigger jail. Additionally, assessments sometimes pick and choose what numbers to look at to justify adding additional jail beds, such as focusing on the average length of stay increasing (because a higher proportion of the population is being held on more serious charges), while failing to properly factor in a significant decline in overall population (because fewer people are being held pretrial or on less serious charges). In the sections that follow, we provide examples of several ways that jail assessments may manipulate numbers to justify the “need” for a bigger jail.
1. The range of years selected can impact the story a jail assessment tells
As seen below, the decision made by jail consultants about what date range to use can have a significant impact on the story they tell about the criminal legal system. It can impact whether an upward or downward trend is described, and can impact the number of jail beds recommended in the assessment.

By choosing to start with 2011 above, a Berks County, Pennsylvania assessment was able to show a 15.5% increase in cases pending by 2020, whereas if the author had selected any year after 2012 as a starting point, the same table would show a decrease of at least 3% by 2020 in cases pending. By starting in 2011, this jail assessment seems to intentionally obscure the downward trend in cases pending in the county over the last 7 years.

Even more suspiciously, when discussing the average daily population (ADP) the Berks County assessment looks at an entirely different date range (2007-2021), and notes more than once that the average annual ADP over this 15-year time span is 1,059. Not only is there no industry standard that gives any value to this 15-year average, but even referencing that average draws attention away from a more important fact: the 38% decline in ADP between 2007 and 2021. Further, because 2007 reflects the highest annual ADP in the years the assessment looked at, starting at any year after 2007 would result in a lower average annual ADP.
The Berks County assessment uses different date ranges throughout — sometimes starting at 2007, 2010, or 2011, and ending at different years, too. While this is sometimes due to the unavailability of data, if you see this in your jail assessments, it is worth pointing out that inconsistent date ranges prevents readers from getting an apples-to-apples comparison.
2. An increased “average length of stay” does not equal the need for a larger jail
It is not unusual for jail assessments to show a reduced number of bookings over time, with an increased number of people with misdemeanor charges being diverted from the jail or released on bail. What this can indicate, however, is a higher proportion of people in the jail who are held on felony charges. When this happens, it is typical to see the average length of stay for people detained in the jail increase, because more serious charges come with both higher, harder-to-afford bail amounts and often longer court processes. Assessments often reference the increased length of stay when recommending a larger county jail, but a longer average length of stay does not necessarily lead to an increased jail population. Further, an increased average length of stay can be addressed by making changes to court processes in order to minimize the amount of time unsentenced people spend in jail, rather than increasing a jail’s capacity to incarcerate.

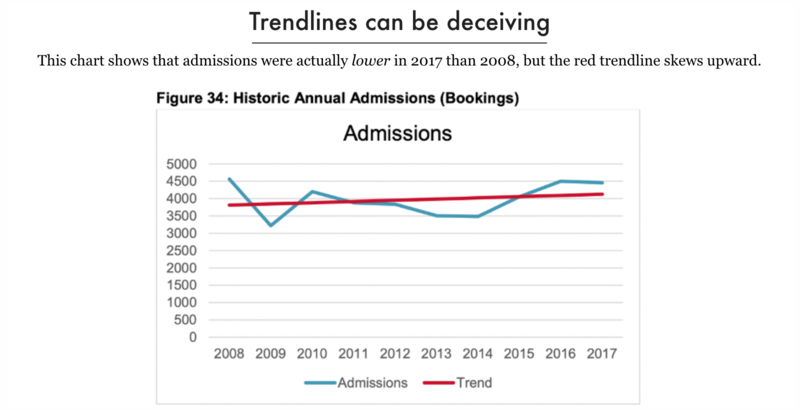
3. Trend lines can be deceiving
In many cases “trend lines” on charts provide a deceptive picture of what is actually happening in the county. And, in some instances, the assessments fail to provide the data used to create the graph and develop a trend line. Instead, the authors assume the reader will take their analysis at face value, even though there are often flaws in their findings.
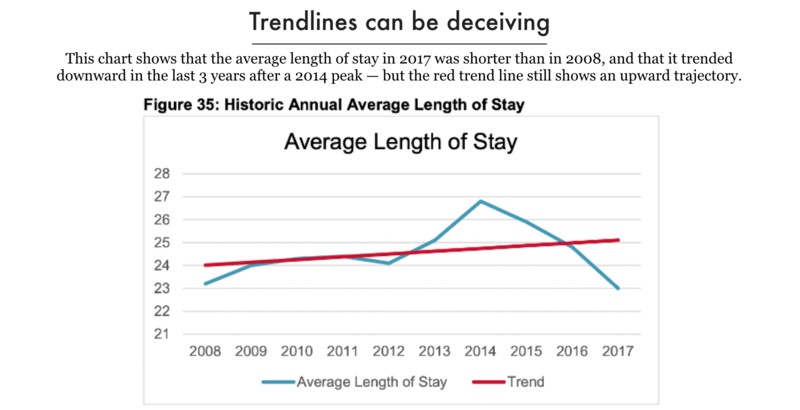
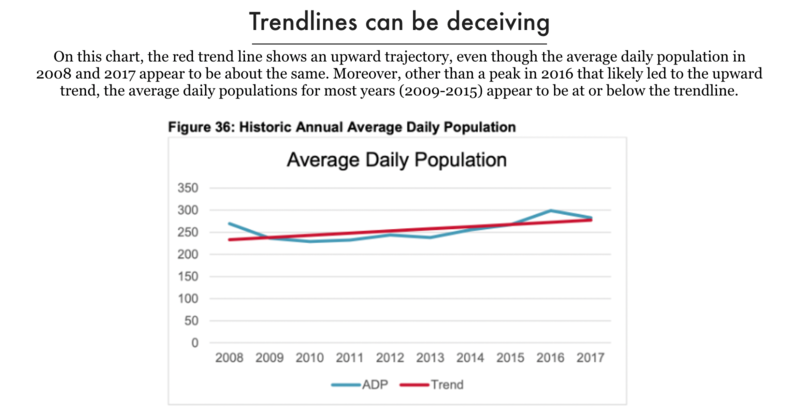
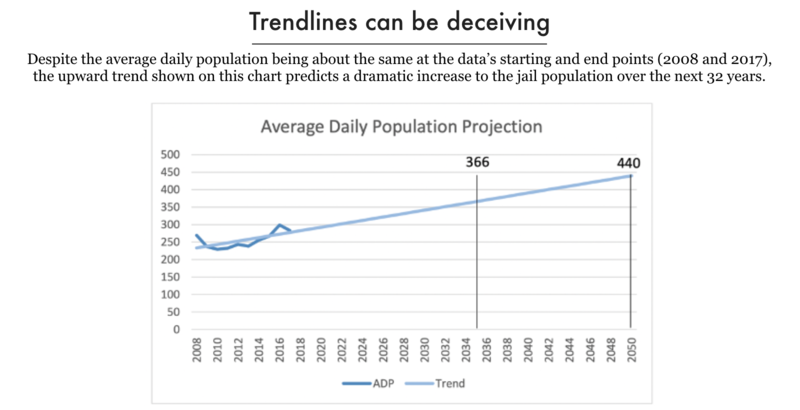
For example, the trend lines from a Greene County, Ohio assessment pictured below indicate an overall upward trend over time in admissions and average length of stay (from 2008-2017), even though the starting and ending numbers for admissions, average length of stay, and average daily population are practically the same or have even decreased. Notably, while the average daily population was practically the same in 2017 as it was in 2008, and was on a downward trend despite reaching a peak in 2016, the trend line skews upward and leads to approximately a 60% increase in the average daily projected population by 2050.2


- Admissions
- Length
- Population
- Projection
In addition, some assessment authors themselves caution against the use of long-term projections like those made for Greene County. For example, an assessment for Cortland County, New York, states:
No one can tell Cortland County officials with certainty what their jail population will look like in the future. The farther down the road, the lower the odds of being anywhere close. There are simply too many moving parts that determine daily jail use, most of which are not within the control of the County Legislature, judges, or even the prosecutor.
…
The confidence interval around the predicted values grows increasingly large as time passes, so forecasts for the near future will be more accurate and meaningful than forecasts for the distant future. [The person who plotted the ADP forecast for Cortland County] included twenty years of forecasts so that the trend line is clear, however, she cautioned not to consider the far future to be accurate.
4. Graphs can be deceptive, or even nonsensical
When looking at jail assessments, it’s important to carefully examine the graphs produced. As seen below, there are times when the intervals between points on a graph are not consistent or the places where numbers are plotted on a graph do not actually align with the scale indicated on an axis. (Also note that they offer four different “trend lines,” without explanation, showing just how easily manipulated these lines can be.)

To read more about the Otsego County jail assessment, see Smoke and mirrors: A cautionary tale for counties considering a big, costly new jail.
Who is being jailed that shouldn’t be?
Assessments include information about why people are being held in the local jail, often broken down by charges, gender, age, who is being held for the federal government or other counties, and what proportion of the jail population has been diagnosed as having severe mental illness or substance use disorders. Looking at this information can help you determine if there are specific reforms that could help reduce the jail population in your county and better meet community members’ needs.
For example, data from Montgomery County, Ohio shows that at least 25% of people are being detained in jail for probation violations or drug possession, and that more than 50% of women are being jailed on misdemeanor charges. Misdemeanors — which include offenses like driving without a license, drug possession, petty theft, shoplifting, trespassing, and disorderly conduct — are considered less serious crimes and are subject to less severe penalties than felony charges. In fact, the vast majority of people charged with a misdemeanor will not see a trial or be sentenced to jail time.3 However, many people charged with misdemeanors are detained pretrial because they cannot afford bail — a problem that researchers have found to have “downstream consequences” for both defendants and public safety.


Understanding why people are being detained in a jail allows you to advocate for reforms that would drive down the jail population and eliminate the need for building a new jail or expanding an existing one. We recommend looking at how many people are in jail who arguably don’t need to be jailed or would be better served elsewhere, such as:
- What proportion of the population is being held for non-criminal “technical” violations of probation or parole?
- How many people are being held pretrial at the jail? For how long? And for what alleged offenses?
- What percentage of the jail population is being treated for mental illness or substance use disorders? What community services, supports, or jail alternatives could be implemented or expanded to drive down the number of people with mental health or substance use disorders who come into contact with the criminal legal system?
- How many people are being held for the federal or state government? For other jails? If contracts with other agencies and jurisdictions are ended, what would the jail population look like?
- How many people are detained on “holds” for probation, parole, or authorities such as U.S. Immigration and Customs Enforcement?
What services are being moved into the jail that should be provided in the community instead?
It is increasingly common for jail assessments to advocate for adding space for housing and treating people with substance use disorders and mental illness,4 as well as chronic or terminal conditions. Often, it appears that because the county has failed to adequately resource programs to reach and treat people with mental health and substance use disorders effectively, the way that people are most likely to receive these services is by being arrested and receiving some version of those services in a jail — which is, by definition, not a therapeutic environment.5 Further, jail assessments have recommended increasing medical housing to treat people with serious, even terminal, illnesses. The Montgomery County, Ohio jail assessment, for instance, noted that the jail is housing people with “Dementia, Parkinson’s Disease, End Stage Cancer, and Stage 4 Liver Cancer” in part because local nursing homes lacked capacity, and recommended adding beds to the jail’s medical unit to provide “24-hour infirmary level care.” In these instances, it is worth asking:
- What services are available in the community? What is their capacity?
- How can community services be better resourced to reach people before they come into contact with the criminal legal system?
- To what extent did the jail assessment examine how effective or comprehensive treatment is for mental illness and substance use disorder in the county and how service providers believe they could be improved?
- To what extent did the jail assessment consider whether additional beds are needed in local hospitals or nursing homes, or discuss what investments should be made in such facilities?
- How could the money going into building or expanding a jail be used to improve health and social services instead?
Other resources
If you are facing a jail expansion fight in your county, you may find these other Prison Policy Initiative resources helpful:
- Smoke and mirrors: A cautionary tale for counties considering a big, costly new jail. Provides an in-depth analysis of a jail assessment from Otsego County, Michigan.
- Does our county really need a bigger jail? A guide for avoiding unnecessary jail expansion. Provides a series of questions to ask when your county is considering increasing jail capacity and best practices that can be implemented to help reduce the number of people incarcerated in your county.
- Tools for fighting jail expansion. Provides a summary of Prison Policy Initiative research and resources to help advocates illustrate the harms of jails to local decision makers. It includes findings about jail overcrowding, counters to arguments for jail expansion, and information about points of intervention in jail fights.
Are you facing a jail expansion fight in your county or do you have questions about a local jail assessment? Feel free to contact us.
Footnotes
For example, the Cortland County, New York jail assessment (2019) notes that new legislation is set to take effect the following year and that has prompted multiple counties to re-evaluate their plans for a new jail, and resulted in some decisions to reduce the size of planned new jails. ↩
The Greene County Average Daily Population Projection is basing a 32-year projection (2018-2050) on only 9 years of data (2008-2017). As a rule of thumb, jail planning expert David Bennett (author of the National Institute of Corrections’ Jail Capacity Planning Guide) suggests that any projections should ideally be supported by an equal number of years of historical data. ↩
For example, of the misdemeanor charges filed in New York City in 2019 and 2020, only 12% proceeded to trial and only 9% resulted in a jail sentence. ↩
A recent trend in jail planning has been the push to establish new mental health units within jails or stand-alone “mental health jails.” For example, Los Angeles County was poised to build a $2.2 billion mental health jail, with the capacity to detain nearly 3,900 pretrial detainees with substance use and mental health disorders. As a result of community activism, and after a report from county health workers “outlining the need for services to be developed along a continuum of care, with significant options for unlocked community-based facilities for individuals with mental health issues,” this jail was ultimately defeated. Even when an entirely new facility isn’t being built, jail expansion and construction plans often involve adding beds or units for people suffering from substance use disorders or mental illness. As Dr. Terry Kupers notes in Psychology Today, while “clinical literature reflects much better treatment outcomes and much lower recidivism rates for individuals with serious mental illness when they are diverted from jail and treated in the community,” there has been a focus on adding “mental health beds” in jails. Kupers states that mental health beds and units are “the trendy guise of new jails today,” allowing Sheriffs to increase their jail capacity and budget. ↩
Incarceration has been shown to create and worsen symptoms of mental illness, and be linked to mood disorders, including major depressive disorder and bipolar disorder. Additionally, jails have repeatedly failed to provide effective health services. For example, people with mental health disorders have limited access to counseling and are not checked on regularly, and while two-thirds of people in local jails have a substance use disorder, most jails do not provide medication-assisted treatment to treat opioid dependency, despite it being considered the gold-standard for care. ↩
Recommended Reading:

Advocacy Toolkit
Resources, tips, and best practices to help advocates working to end mass incarceration.

50 state incarceration profiles
All of our recent reports about prison/jail growth, racial disparities, and more, re-organized by state.

Mass Incarceration: The Whole Pie
The U.S. incarcerates nearly 2 million people. Where are they locked up and why? Read our report.
