Homelessness is the greatest predictor of involvement with the juvenile justice system. And since LGBTQ youth compose 40% of the homeless youth population, they are at an increased risk of incarceration.
by Daiana Griffith,
January 22, 2019
In a recent report, we found a strong link between incarceration and homelessness among formerly incarcerated people. But while we examined racial and age disparities among that population, we weren’t able to address how homelessness affects justice-involved youth — especially LGBTQ youth who are overrepresented in the juvenile justice system. In this piece, we highlight research that elucidates the relationship between homelessness and LGBTQ youth incarceration, while also emphasizing how homelessness and incarceration disproportionately affect LGBTQ youth of color.
LGBTQ youth face higher rates of detention and incarceration. A 2015 study shows that 20% of all youth in the juvenile justice system identify as lesbian, gay, bisexual, questioning, gender nonconforming, or transgender, even though they compose only 5 to 7% of the total U.S. youth population. (Troublingly, the portion that identify as LGBTQ and/or gender nonconforming is even higher for girls in the juvenile justice system, at 40%.) This high percentage of justice-involved LGBTQ youth may be driven by their even higher rates of homelessness.
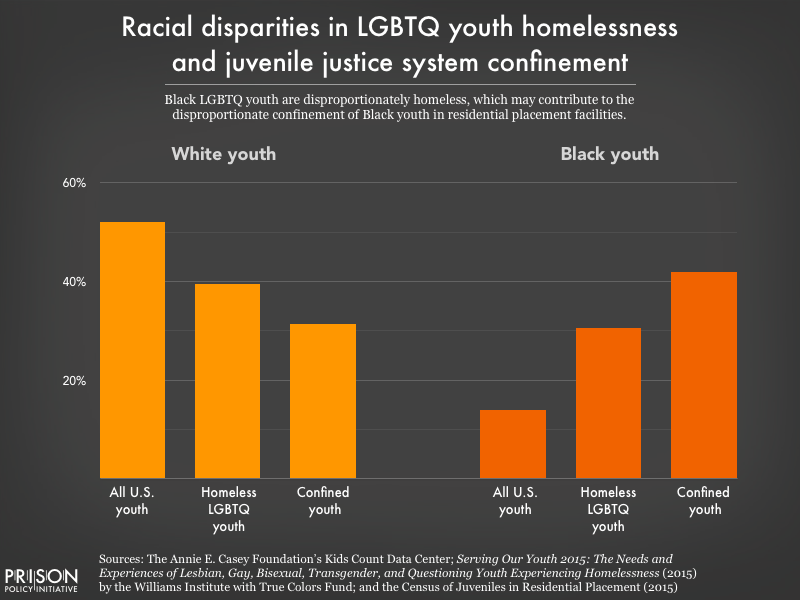 While white youth are underrepresented among the homeless LGBTQ youth and confined youth populations, Black youth are overrepresented among both groups. Black youth made up just 14 percent of the total youth population in 2014, but 31% of the homeless LGBTQ youth population that year, and 42% of the confined youth population in 2015.
According to a Center for American Progress report, homelessness is the greatest predictor of involvement with the juvenile justice system, and 40% of homeless youth identify as LGBT. LGBTQ youth usually face homelessness after fleeing abuse and lack of acceptance at home because of their sexual orientation or gender identity. Once homeless and with few resources at hand, LGBTQ youth are pushed towards criminalized behaviors such as drug sales, theft, or survival sex, which increase their risk of arrest and detainment.
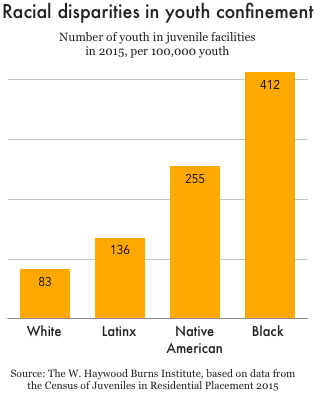
LGBTQ youth of color — particularly Black youth — are at an increased risk of criminalization. This, in part, reflects the fact that LGBTQ youth of color have disproportionately high rates of homelessness. A 2014 survey of human service providers serving homeless youth, for instance, reported that 31% of the LGBTQ youth they served identified as African-American or Black, despite Black youth making up only 14% of the general youth population in 2014. The racial disparities in youth homelessness contribute to the overrepresentation of youth of color in juvenile facilities in general; in 2015, 2 out of 3 youth in juvenile facilities were either Black, Hispanic, or American Indian.
The disparities in youth incarceration mean that LGBTQ youth, and especially youth of color, also face the harms related to incarceration at greater rates. Incarceration, for example, can be detrimental to young people’s physical and mental health, their relationships, and their social and economic prospects. Among these different consequences, access to stable housing can be especially negatively affected.
Youth in the juvenile justice system are likely to end up with juvenile delinquency records that can prevent them from accessing housing and finding employment once released. Similar to formerly incarcerated adults, justice-involved youth are subjected to discrimination by public housing authorities and private property owners, which, combined with affordable housing shortages, exposes them to housing insecurity.
In the case of justice-involved LGBTQ youth, housing discrimination based on criminal records can be compounded by housing discrimination against LGBTQ people. A 2017 study based in the D.C. metropolitan area found that housing providers were less likely to book an appointment with gay men, as well as less likely to tell homeseekers who disclosed their transgender identity about available units.
These alarming statistics remind us that LGBTQ youth are at a higher risk of both homelessness and incarceration, and the many harms accompanying these situations. This means that if we are to put less youth behind bars, we must address the specific needs of LGBTQ youth who often end up homeless because of family conflict. In addition, we have to make finding stable housing post-release and eradicating discrimination based on criminal records a priority to avoid cycles of reincarceration.
Daiana Griffith is a student at Mount Holyoke College, graduating in May 2019. She contributed this post as a student volunteer over the winter term.
While preparing a report grading every state's parole release system, Jorge Renaud takes a deep dive into what makes a parole system fair and just.
by Jorge Renaud,
January 2, 2019
When someone from the Northeast hears I’m on parole for a robbery in Texas, they invariably say something like, “Boy, I bet you’re glad you live in Massachusetts now,” assuming that the parole system in Massachusetts is as progressive as the state’s political reputation. As we prepare a report grading the parole release systems of all 50 states, the time is right to address this question — and dispel some myths.
From 30,000 feet the criminal justice landscapes of Texas and Massachusetts look very much as we expect from such typically red and blue states. Texas actively puts people to death; Massachusetts abolished the death penalty in 1982. You can’t vote in Texas if you have a felony conviction and are either incarcerated or on any type of supervision. In the Commonwealth, the only people denied the right to vote are in prison with felony convictions, but once they are out they can vote whether or not they are on parole or probation. And when it comes to sheer numbers, Massachusetts has the lowest incarceration rate in the country, with 324 individuals behind bars for every 100,000 residents, compared to the Texas rate of 891, the 7th highest among all states.
However, when it comes to parole, I’ve found that states that look progressive may in fact be oppressive, and those we dismiss as backwards might in fact face forward.
Prisons are the most visible, obvious manifestation of criminal justice. And for those incarcerated in prisons, the experience is shaped by hope: that they will someday leave prison, join civil society and never return. The likelihood that this hope will be realized in a given state — that an incarcerated person will be released and not return to prison — can largely be quantified. Measurable outcomes of state policies affect their chances: the frequency with which people are given life sentences, the average time incarcerated individuals actually serve, how often parole is granted, and how often paroled individuals are sent back to prison for minor, non-criminal violations rather than supported as they move back into society. Together, these factors make up what I’ll call a state’s “hope index” for people serving long sentences.
Let’s look at the factors that comprise the “hope index” of Texas and Massachusetts. Two of those measures are fairly even — how long individuals stay in prison and how readily they are released on parole. In 2015, Bureau of Justice Statistics data showed that 15 percent of individuals in Texas prisons had been there over 10 years. For Massachusetts, that number was 19 percent. The Robina Institute reported that in 2014, 36 percent of all parole hearings in Texas resulted in release being granted. Robina’s latest data for Massachusetts is for 2013, when the Commonwealth paroled 34 percent of all individuals eligible for release who actually attended hearings. (That same year, the Massachusetts Parole Board reported that the “paroling rate” was 58 percent. However, that number doesn’t take into account the 2,944 waivers by incarcerated individuals who “may not be interested in adhering to expected parole conditions….” More on that in a moment.)
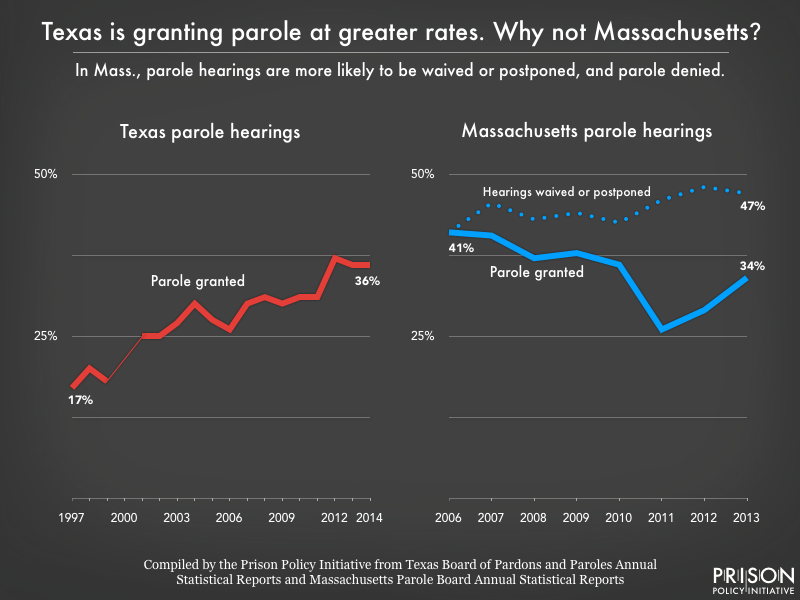 Figure 1. In Texas, the parole grant rate more than doubled between 1997 and 2014 (no data were available for 2000). In Massachusetts, the grant rate fell between 2006 and 2013, while the portion of hearings that were waived or postponed increased, to make up nearly half of all scheduled release hearing outcomes in 2013. (For an explanation of this data, and why our calculated grant rates for Massachusetts are lower than those reported by the state, see the data note at the bottom of this post.)
The gap in the “hope index” becomes wider when we look at those who have an expectation of release. The Sentencing Project argues that sentences of over 50 years are “virtual life” sentences and adds those to the count of individuals sentenced to either life or life without parole (LWOP). By that count, one of every four people in a Massachusetts prison in 2016 was serving a life or virtual life sentence — the 6th highest rate in the country. Texas ranked 28th in that dismal category, with 12 percent of all individuals in Texas prisons serving life or virtual life sentences. (Lest the Commonwealth believe that including “virtual” life sentences is unfair, using just LWOP sentences leaves Massachusetts with the 2nd highest rate; 12 percent of everyone in Massachusetts prisons have LWOP sentences, trailing only Louisiana’s 13 percent. In Texas, that number is 0.5 percent.)
When it comes to staying out after release on parole, the two states again look very different from what we might expect. In 2016, Massachusetts returned 490 individuals on parole to prison; 83 percent of those were returned for a technical violation (that is, without committing a new offense). Texas returned 7,142 to its prisons, of which 18 percent were for technical violations without a new offense. Put a different way, in 2016 Massachusetts returned almost a quarter (22 percent) of its entire parole population to prison without any of them committing a new offense, while Texas returned just one percent for technical violations. In Texas, parole offers a real hope of success for those released. In Massachusetts; well, as state officials themselves write, “By virtue of being under supervision in the community, an inmate may have a higher likelihood of re-incarceration.”
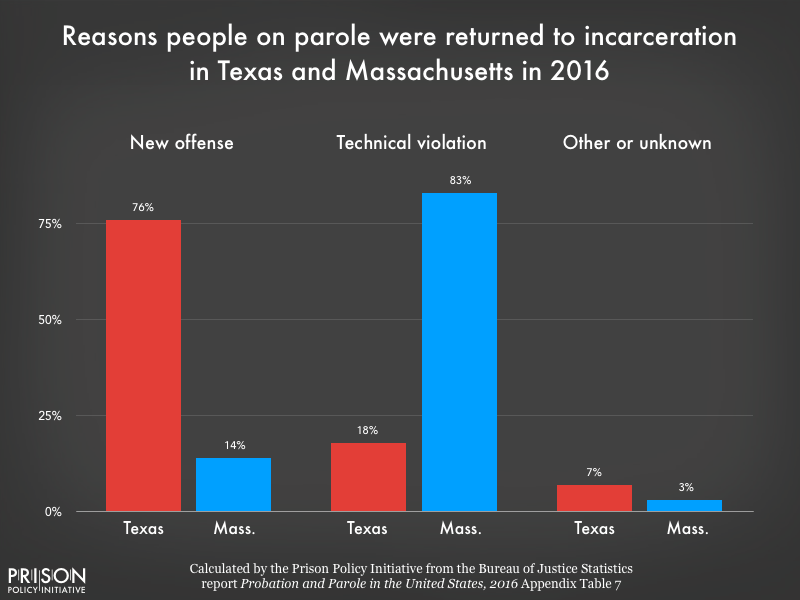 Figure 2. While Texas has a much larger parole population overall, and therefore returned more people to incarceration in 2016, three-quarters of returns to incarceration in Texas were for new offenses. Meanwhile, technical violations accounted for more than 4 out of 5 returns to incarceration from parole in Massachusetts.
Why does Massachusetts have such a low “hope index,” especially compared to Texas? Maybe the Commonwealth is diverting individuals with low-level offenses and only sending individuals to prison who commit serious and violent crimes. However, in both states, violent offenses account for approximately two-thirds of the prison population (60 percent in Texas compared to 70 percent in Massachusetts).
It may be that the Massachusetts “hope index” is skewed because over half of all scheduled parole release hearings are postponed or waived. By far the largest percentage of individuals leaving prison in the Commonwealth discharge their sentence, or “max out.” This means that a large number of individuals in Massachusetts prefer to finish their sentence rather than be on parole. (Which begs the question: Why?)
The truth, however, is simpler. First, despite the “throw away the key” rhetoric of the state’s politicians, the Texas Board of Pardons and Paroles has doubled its parole grant rate from 18 percent in 1999 to 36 percent in 2014, which was a big part of why the overall incarceration rate in Texas dropped from 1,050 in 2003 to 837 in 2014.
Second, the Texas Board of Pardons and Paroles doesn’t revoke many individuals on parole, especially not for technical violations without a new offense. The agency has not returned more than 3 percent of its parole population to prison for a technical violation since at least 2006, when the Bureau of Justice Statistics began compiling that data.
But most critically, the Texas Board of Pardons and Paroles only votes on releases and revocations — its staff do not supervise individuals on parole. That is done by the Parole Division of the Texas Department of Criminal Justice. This means parole officers in Texas are free from the political pressure that Massachusetts parole officers and supervisors surely feel, because in the Commonwealth, the officers out in the field are directly accountable to the political appointees who grant parole.
If you think that isn’t important, consider that then-Governor Deval Patrick cleaned out the entire Massachusetts Parole Board in 2011 for voting to release — and improperly supervising — Domenic Cinelli, who killed a Woburn police officer while on parole. Contrast that to the reaction of Texas parole officials when recently paroled Jose Gilberto Rodriguez killed three people and shot two others in July of 2017, sending Houston into a panic. Texas politicians didn’t hurl charges at the Board of Pardons and Paroles or its members, and an agency official told me they didn’t take those events lightly, but that those things “happen” and they did not plan any changes, in either supervision or release policies.
A final crucial difference between Texas and Massachusetts parole policies has a less quantifiable outcome, but surely affects individual success at rejoining civil society: In Texas, unlike Massachusetts, people under parole supervision are able to connect with other formerly incarcerated people, even if all are on parole, and draw on each other as a source of support. There are groups of individuals on parole and probation in Texas who are active politically, and whose voices and experiences are respected at meetings of city councils, commissioners’ courts, and at the Capitol. Massachusetts, in contrast, has a general parole condition that specifically prohibits anyone on parole from engaging “in a continuous pattern of association with persons known to have a criminal record…” and, in no uncertain terms, warns those on parole that they must, at the risk of revocation, tell their parole officer any time they are going to be in the presence of someone who has a criminal record. For those on parole, this policy not only isolates them from those who might best support and advise them as they move back into their communities — it gives any individual on parole the subtle message that they, too, are viewed with suspicion, and that others are warned against associating with them.
It’s impossible to explain the fact that Massachusetts — progressive, blue-state Massachusetts — returned to incarceration in 2016 almost a fourth of all individuals being supervised by the state parole board without those individuals being convicted of a new crime. So I won’t try.
What I can say is that “red” and “blue” don’t tell the entire story. Texas should take a hint from Massachusetts when it comes to slowing down incarceration rates, and Massachusetts could learn a thing or two from Texas about how to keep politics out of parole and give people serving long sentences a real reason to hope.
A note about the data
Those familiar with Massachusetts Parole Board statistics may wonder why the parole grant rates presented in Figure 1 are much lower than those reported by the Parole Board in their Annual Statistical Reports. This is because the Commonwealth excludes from its calculation all scheduled release hearings that are waived or postponed, and therefore do not result in a vote. In other states, this might not make much of a difference. But because so many hearings are waived or postponed in Massachusetts by those eligible for parole, ignoring those outcomes dramatically inflates the grant rate. Using reports from 2006 to 2013, we were able to recalculate the grant rates to include the waived and postponed release hearings. However, since 2014, the Parole Board annual reports no longer state how many release hearings were waived or postponed (instead, these hearings are lumped together with other kinds of hearings). It is therefore impossible to calculate a comparable grant rate for Massachusetts after 2013.
 While white youth are underrepresented among the homeless LGBTQ youth and confined youth populations, Black youth are overrepresented among both groups. Black youth made up just 14 percent of the total youth population in 2014, but 31% of the homeless LGBTQ youth population that year, and 42% of the confined youth population in 2015.
 Figure 1. In Texas, the parole grant rate more than doubled between 1997 and 2014 (no data were available for 2000). In Massachusetts, the grant rate fell between 2006 and 2013, while the portion of hearings that were waived or postponed increased, to make up nearly half of all scheduled release hearing outcomes in 2013. (For an explanation of this data, and why our calculated grant rates for Massachusetts are lower than those reported by the state, see the data note at the bottom of this post.)
 Figure 2. While Texas has a much larger parole population overall, and therefore returned more people to incarceration in 2016, three-quarters of returns to incarceration in Texas were for new offenses. Meanwhile, technical violations accounted for more than 4 out of 5 returns to incarceration from parole in Massachusetts.

