States of Incarceration: The Global Context 2018
By Peter Wagner and Wendy Sawyer
June 2018
This report is has been updated with a new version for 2024.
Oklahoma now has the highest incarceration rate in the U.S., unseating Louisiana from its long-held position as “the world’s prison capital.” By comparison, states like New York and Massachusetts appear progressive, but even these states lock people up at higher rates than nearly every other country on earth. Compared to the rest of the world, every U.S. state relies too heavily on prisons and jails to respond to crime.
Rates calculated per 100,000 people. Read more about the data.
Figure 1. This graph shows the number of people in state prisons, local jails, federal prisons, and other systems of confinement from each U.S. state per 100,000 people in that state and the incarceration rate per 100,000 in all countries with a total population of at least 500,000.
The graphic above charts the incarceration rates of every U.S. state alongside those of the other nations of the world. And looking at each state in the global context reveals that, in every region of the country, incarceration is out of step with the rest of the world.

If we imagine every state as an independent nation, as in the graph above, every state appears extreme. 23 states would have the highest incarceration rate in the world — higher even than the United States. Massachusetts, the state with the lowest incarceration rate in the nation, would rank 9th in the world, just below Brazil and followed closely by countries like Belarus, Turkey, Iran, and South Africa.
In fact, many of the countries that rank alongside the least punitive U.S. states, such as Turkmenistan, Thailand, Rwanda, and Russia, have authoritarian governments or have recently experienced large-scale internal armed conflicts. Others struggle with violent crime on a scale far beyond that in the U.S.: El Salvador, Russia, Panama, Costa Rica, and Brazil all have murder rates more than double that of the U.S. Yet the U.S., “land of the free,” tops them all.
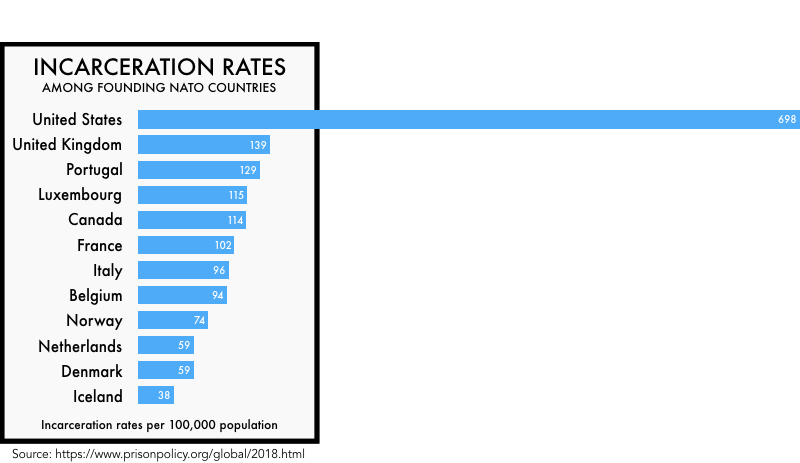
But how does the U.S. compare to countries that have stable democratic governments and comparable crime rates? Next to our closest international peers, our use of incarceration is off the charts:
Compare another state:
or compare just the U.S. with its peers.
Conclusion
For four decades, the U.S. has been engaged in a globally unprecedented experiment to make every part of its criminal justice system more expansive and more punitive. As a result, incarceration has become the nation’s default response to crime, with, for example, 70 percent of convictions resulting in confinement — far more than other developed nations with comparable crime rates.
Today, there is finally serious talk of change, but little action that would bring the United States to an incarceration rate on par with other stable democracies. The incremental changes made in recent years aren’t enough to counteract the bad policy choices built up in every state over decades. For that, all states will have to aim higher, striving to be not just better than the worst U.S. states, but among the most fair and just in the world.
Methodology
Like our report, Mass Incarceration: The Whole Pie, this report takes a comprehensive view of confinement in the United States that goes beyond the commonly reported statistics by more than 100,000 people to offer a fuller picture of this country’s different and overlapping systems of confinement.
This broader universe of confinement includes justice-involved youth held in juvenile residential facilities, people detained by the U.S. Marshals Service (many pre-trial), people detained for immigration offenses, sex offenders indefinitely detained or committed in “civil commitment centers” after completing a sentence, and those committed to psychiatric hospitals as a result of criminal charges or convictions. They are not typically included in the official statistics that aggregate data about prison and jails for the simple reason that these facilities are largely separate from the state and local systems of adult prisons and jails. That definitional distinction is relevant to the people who run prisons and jails, but is irrelevant to the advocates and policymakers who must confront the overuse of confinement by all of the various parts of the justice systems in the United States.
We included these confined populations in the total incarceration rate of the United States and, wherever state-level data made it possible, in state incarceration rates. In most states, these additions have a small impact on the total rate, and they don’t impact the rankings by more than one or two positions for any state. In a few places, however, these other systems of confinement merit closer attention. For example, although Minnesota has one of the lowest overall incarceration rates, Minnesota is second only to the much larger state of California for civil commitment and detention of people convicted of sex offenses. Other states, including Oregon, Pennsylvania, and Indiana, confine large numbers of youth, to the point that the inclusion of these youth adds more than 20 people per 100,000 to their incarceration rates.
As a result of our choice to take a broader view of incarceration, this report creates a unique U.S. dataset that offers a complete look at all kinds of justice-related confinement in each state. We explain our specific data sources in more detail below and provided the raw data for the component parts of our calculations in an appendix to this report.
Our data on other countries comes from the indispensable Institute for Criminal Policy Research’s World Prison Brief.
Detailed data notes and sources
For the 50 U.S. states, we calculated incarceration rates per 100,000 total population that reflect our holistic view of confinement, which include:
- people in state prison in each state,
- people in local jails in each state,
- people in federal prison from each state,
- people held by the U.S. Marshals Service from each state,
- people held in jails in Indian Country in each state,
- youth held in juvenile justice facilities from each state,
- justice-involved people involuntarily committed to other kinds of confinement in each state (i.e. sex offenders held under “civil commitment” laws and people held in state psychiatric hospitals because of criminal charges or convictions.)
The raw data is available in a data appendix and the individual sources were as follows:
- State prisons and local jails: Correctional Populations in the United States, 2016 Appendix Table 1 reports the number of people under prison and jail jurisdiction as of December 31, 2016. This report, published in April 2018, is the newest available data that provides a combined state prison and local jail count that avoids double counting state prisoners being held in local jails. (A small number of states have contractual relationships with local jails that place large numbers of state prisoners in local jails. Failing to correct for this double counting would significantly and incorrectly increase the incarceration rate for select states.)
- Federal prisons and U.S. Marshals Service: While federal prosecutions are nominally the result of federal policy, we attributed federal convictions to individual states in part because federal prosecutions are of state residents and in part because federal prosecutions are often coordinated with state prosecutors and state law enforcement. (In this way, our methodology departs from the way that the Bureau of Justice Statistics calculates state rates. In Correctional Populations in the United States, 2016, U.S. Marshals Service detainees are not included at all, and other federal prisoners are included in the total national incarceration rate but do not affect state incarceration rates.)
To develop estimates of the number of people in federal prison from each state, we developed a ratio of the state of legal residence for the Bureau of Prisons population as of March 26, 2016 — based on FOIA request 2016-05586 — and applied it to the total federal prison population of 225,210 calculated for our report Mass Incarceration: The Whole Pie 2018 and explained in the “Read about the data” section of that report. This calculation includes the 51,400 people under federal (largely pretrial) detention by the U.S. Marshals Service who are often left out of similar statistics. While we did not have state of residence information for this federal population, we used the same ratio to reallocate these people to states as we did for those under BOP jurisdiction. We reasoned that people under federal jurisdiction, regardless of status (convicted, pretrial, or in transit), would likely come from the states in the same proportions. - Indian country jails: Jails in Indian Country, 2016 Appendix Table 4 reports the number of adults and youth held in jails in Indian country as of June 30, 2016 by state. Unfortunately, this survey did not include data for 5 facilities: one in Arizona, one in Nebraska, and three in South Dakota. For our calculated national incarceration rate, we used the number estimated by the Bureau of Justice Statistics (which imputes data for non-reporting facilities). For the state rates, we used the reported numbers, since estimates were not available by state.
- Youth confinement: Because the United States confines large numbers of youth through the juvenile justice system, we included these youth in our national and state incarceration rates. Youth confined in places other than prison are not included in other countries’ incarceration rates in this report, but their inclusion would not change other countries’ rates much anyway. The 48,043 confined youth in the U.S. add 14.8 incarcerated people per 100,000 population to the national rate. Canada’s rate, by comparison, would only increase by 2.8 per 100,000; and Italy’s rate would increase by less than 1 person per 100,000. In England and Wales, youth in Immigration Removal Centres are already included in that nation’s data. Juveniles in other kinds of facilities in England and Wales are not included in their data, but including them would increase the overall rate for England and Wales by less than 1 person per 100,000. We did not make these adjustments because for most countries, these data are not available or are not comparable to the system of youth confinement in the U.S.
For youth in the U.S., the Census of Juveniles in Residential Placement reports the number of people younger than 21 who were detained or committed in residential placement facilities in 2015, the most recent year for which data are available. We included the national total of 48,043 in the national incarceration rate, but state of offense was not reported for 1,593 youth. Only those youth for whom state of offense was reported were included in the state incarceration rates. (For more on this population, see our more detailed report Youth Confinement: The Whole Pie.) - Involuntary commitments:The number of people involuntarily committed to state psychiatric hospitals because of involvement with the criminal justice system (either for evaluation/treatment as incompetent to stand trial or for treatment after being found not guilty by reason of insanity) come from pages 91-92, 98-99, and 103-104 of the August 2017 NRI report Forensic Patients in State Psychiatric Hospitals: 1999-2016, reporting 2014 data by state for 37 responding states. We did not attempt to estimate these populations for non-responding states; we counted them as zeros. Therefore, the incarceration rates for these states may be understated if they do confine people under similar conditions. Finally, we made a correction to the NRI data for the number of people held for pre-trial evaluations in Arkansas, after speaking with an official from the state’s program for forensic patients. The NRI report shows a pre-trial evaluation population of 1,406 in 2014, but this number included outpatient evaluations. The number of inpatient initial criminal forensic evaluations that year was 9.
The data on people convicted of sexual offenses who are detained or committed under civil commitment laws after their sentences are complete comes from an annual survey conducted by the Sex Offender Civil Commitment Programs Network shared by SOCCPN President Shan Jumper. Except for North Dakota, all counts are from their 2017 survey (North Dakota did not respond in 2017, so its count is from 2016.) Interestingly, the inclusion of this population makes very little difference for most states, with Minnesota being a notable exception, as described above. Involuntary commitments were included in our state incarceration rates for every state where data were available. The national incarceration rate includes all of these and an additional 63 people civilly committed under federal jurisdiction, who were not apportioned back to any states of residence. - Population data for each state, used to calculate the incarceration rates, were based on our state population estimates for December 31, 2016. Because the bulk of our incarceration counts are for yearend 2016, we averaged the U.S. Census estimates for July 1, 2016 and July 1, 2017. Our final estimate for each state is in the appendix.
Three additional categories of confinement are included in the national incarceration rate for the United States, but not in state rates, because state-level data were not available:
- Territorial prisons: The incarcerated populations under the jurisdictions of the U.S. Territories of American Samoa, Guam, and the U.S. Virgin Islands, and U.S. Commonwealths of Northern Mariana Islands and Puerto Rico are reported in Prisoners in 2016 Table 20, reporting data for December 31, 2016.
- Immigration detention: The average daily population under the custody of Immigration and Customs Enforcement (ICE) in November 2017 is reported in “ICE Detention Facilities As Of November 2017” by the National Immigrant Justice Center. The analysis is based on data obtained via Freedom of Information Act request by the Immigrant Legal Resource Center; the data are available for download from the same source.
- Military prisons: Prisoners in 2016 Table 18 reports data as of December 31, 2016.
For the incarceration rates of other countries, we used the most recent incarceration rate data available from the Institute for Criminal Policy Research’s World Prison Brief in May 2018. For this report, we decided to accept the World Prison Brief’s definition of country, choosing to exclude countries only for reasons of population size. To make the comparisons more meaningful to U.S. states, we’ve chosen to include only independent nations with total populations of more than 500,000 people.
In order to make the graph comparing the founding NATO nations to individual states, however, we had to make two exceptions to this policy. First, we included Iceland, which is a founding NATO member, even though its population is below 500,000. We also aggregated the total incarcerated and total population data for the three separate nations of England and Wales, Scotland and Northern Island, into the one member of NATO, the United Kingdom.
A note about the District of Columbia and U.S. territories: This report focuses on comparing individual states to other countries, so we chose to not include the District of Columbia, American Samoa, Guam, Northern Mariana Islands, Puerto Rico, or the U.S. Virgin Islands in the main graphic in this report, although we did make separate NATO comparison graphics for these places. However, the incarceration data for D.C. and the territories, where they exist, are in our appendix and the final incarceration rate calculations for D.C. and the territories are:
| Jurisdiction | Incarceration Rate |
|---|---|
| District of Columbia | 1,153 |
| American Samoa | 340 |
| Guam | 557 |
| Northern Mariana Islands | 529 |
| Puerto Rico | 442 |
| U.S. Virgin Islands | 798 |
Privacy policy
This report requests your location so that we can provide you with a visual comparing your state’s use of incarceration to the founding NATO countries. If you gave us this permission, we discarded your location data as the page finished loading. If you did not give us this permission — or if your browser was configured to decline permission automatically — this report simply makes an educated but unrecorded guess based on your IP address about what state’s data you will find most relevant.
Acknowledgements
All Prison Policy Initiative reports are collaborative endeavors, but this report builds on the successful collaborations of the 2014, and 2016 versions. Beyond the original structure developed by data artist Josh Begley, the authors of this year’s report are particularly indebted to Jordan Miner for helping us offer state-specific graphs, to Joshua Herman for showing us how to add the labels to the main graphic, to Robert Machuga and Elydah Joyce for design assistance, to our colleague Wanda Bertram for feedback, and to the International Centre for Prison Studies for aggregating comparable world incarceration data in the invaluable World Prison Brief.
This report was supported by a generous grant from the Public Welfare Foundation and by our individual donors, who give us the resources and the flexibility to quickly turn our insights into new movement resources.
About the authors
Peter Wagner is an attorney and the Executive Director of the Prison Policy Initiative. He co-founded the Prison Policy Initiative in 2001 in order to spark a national discussion about the negative side effects of mass incarceration. Some of his most recent work includes Following the Money of Mass Incarceration, examining the cost of imprisonment in the U.S., including who benefits and who pays. He is @PWPolicy on Twitter.
Wendy Sawyer is a Senior Policy Analyst at the Prison Policy Initiative. Most recently, she authored Youth Confinement: The Whole Pie and The Gender Divide: Tracking women’s state prison growth.
Peter and Wendy also recently co-authored the Prison Policy Initiative’s report Mass Incarceration: The Whole Pie 2018, which features a series of innovative data visualizations to provide a comprehensive view of the various systems of confinement in the United States.
About the Prison Policy Initiative
The non-profit, non-partisan Prison Policy Initiative was founded in 2001 to expose the broader harm of mass criminalization and spark advocacy campaigns to create a more just society. The organization is known for its visual breakdown of mass incarceration in the U.S., as well as its data-rich analyses of how states vary in their use of punishment. The Prison Policy Initiative’s research is designed to reshape debates around mass incarceration by offering the “big picture” view of critical policy issues, such as probation and parole, women’s incarceration, and youth confinement.


