Visualizing changes in the incarcerated population during COVID-19
Initial policy changes that resulted in quick and necessary decarceration have slowed, despite the growing infection and death rate of COVID-19 in prisons and jails.
by Emily Widra, September 10, 2020
This article was updated on October 21st, 2021 with more recent jail and prison population data. That version should be used instead of this one.
After the World Health Organization declared COVID-19 a global pandemic, it became painfully obvious that people incarcerated in jails and prisons would be uniquely vulnerable to both the spread of the disease and the more serious medical consequences of the disease due to the high prevalence of preexisting health conditions.
Now, when all of the top 10 clusters of COVID-19 in the U.S. are linked to prisons and jails, and with the 997 COVID-19 deaths behind bars surpassing the number of COVID-19 deaths in 19 states and Washington, D.C., state and local governments should be redoubling their efforts to reduce the number of people in confinement. But our most recent analysis of jail and prison populations shows that many of the efforts to reduce incarcerated and detained populations have actually slowed–and even reversed in many counties and states.
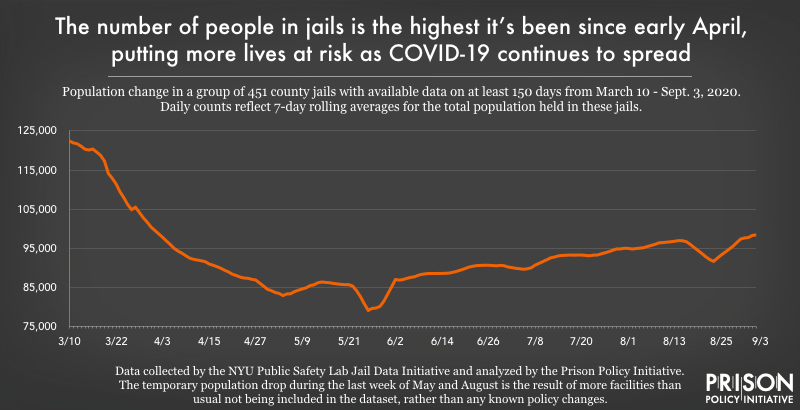
- Jail populations dropped quickly at the beginning of the COVID-19 pandemic, but the local authorities who run jails have not sustained those efforts and populations have started to rise over the last two months. Across the 451 county jails we analyzed, 98% of the jails saw population decreases from March to May, with an average population reduction of 33%. But 82% of jails had population increases from May to September, suggesting that most jurisdictions have abandoned the efforts to decarcerate that made such crucial changes early in the pandemic. In 88 counties, jail populations are higher now than they were before the pandemic, including in some large counties like Wayne County (Detroit), Michigan, where the jail population on March 10th was 2,086 people and is now over 2,400 people.
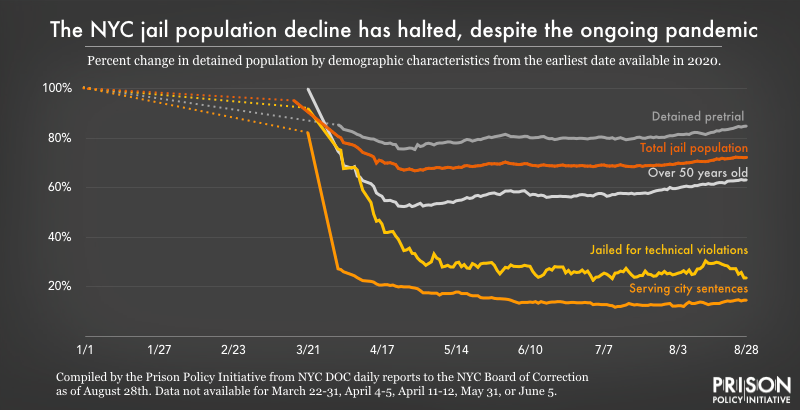
- In New York City, the jail population sharply declined after the pandemic was declared. Importantly, NYC jails–particularly Rikers Island–were some of the first jails in the country to witness a COVID-19 outbreak. And yet, across different demographics, NYC jail populations have slowly leveled out, suggesting that the policies responsible for the necessary decarceration are no longer in practice.
- In early August, we reported that state prison populations had been steadily declining, but that the progress was still too slow to save lives. Now, with updated data from mid-to-late August, we can see that this progress continues to be slow, with little to no change between July and August prison populations in North Carolina, Arizona, Mississippi, Wisconsin, Vermont, Maine, Utah, and North Dakota. California has reduced its state prison population by about 7% since the end of July, likely due in part to the state’s response to the COVID-19 outbreak in San Quentin State Prison in early August, but as of September 2nd, California’s state prisons were still holding more people than they were designed for, at 108% of their design capacity.
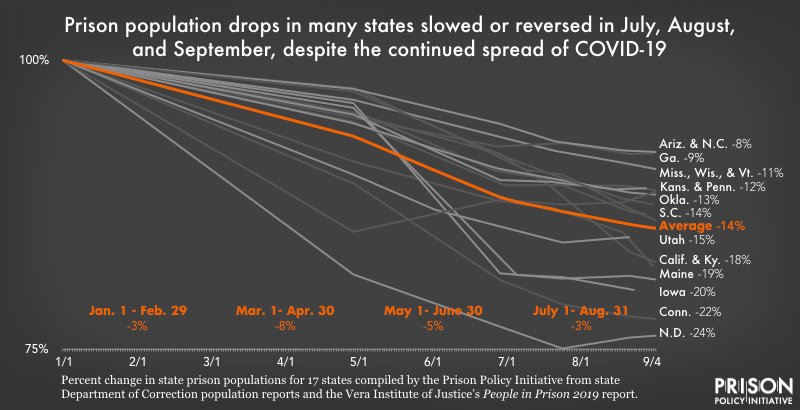
Sharp-eyed readers may wonder if Connecticut and Vermont are showing larger declines than most other states because they have “unified” prison and jail systems, but separately published data from both states show that the bulk of their population reduction is coming from within the “sentenced” portion of their populations. (For the Connecticut data, see the Correctional Facility Population Count tracker, and for Vermont, compare the March 13 and September 4 population reports.)


Prisons and jails are notoriously dangerous places during a viral outbreak, and continue to be the source of the largest number of infections in the U.S. The COVID-19 death rate in prisons is three times higher than among the general U.S. population, even when adjusted for age and sex (as the prison population is disproportionately young and male). Despite agreement among public health professionals, corrections officials, and criminal justice reform advocates that decarceration will protect incarcerated people and the community-at-large from COVID-19, state, federal, and local authorities continue to put incarcerated people’s lives at risk– and by extension, the communities in which incarcerated people and correctional staff live and work.


Thank you for your efforts to bring this information to into public view. There are so many conflicting sources of data on Covid-19 in correctional facilities, both prisons and jails, which hold many individuals who have not yet been convicted of crimes. Anyone with basic numeracy, who sits down with the most conservative set of statistics reporting death rates and racial and age composition of incarcerated populations cannot help but conclude that there are a massive number of unreported cases, as well as deaths, within this population.
Your concise text and compelling graphics provide a model for any mainstream media outlet looking to expose this mounting tragedy. Please keep us updated.