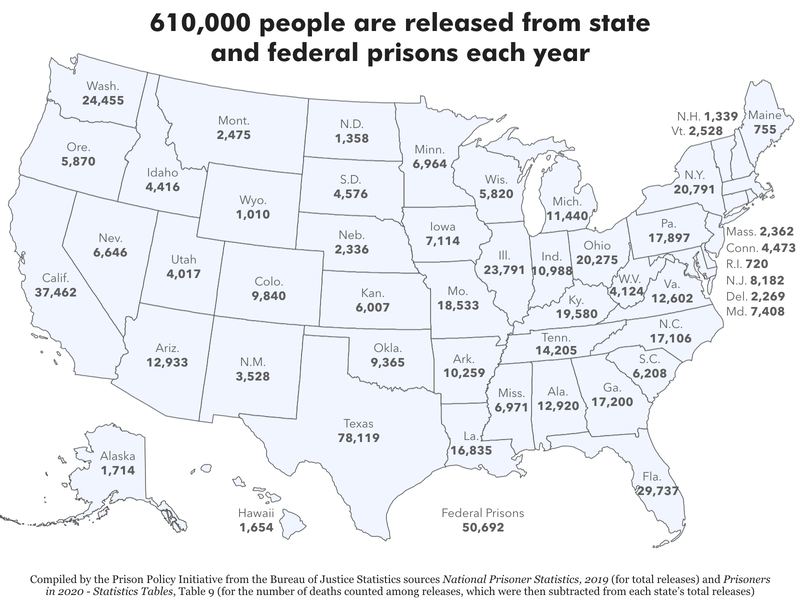
Since you asked: How many people are released from each state’s prisons and jails every year?
The number of people going through reentry each year vastly exceeds the resources available to them in most communities.
by Wendy Sawyer, August 25, 2022
We’ve released an updated version of this briefing that also breaks down releases by sex.
The key role of reentry programs and services in the success of people released from prisons and jails cannot be overstated. People returning to their communities from even relatively short periods of incarceration often have acute needs related to health, employment, housing, education, family reunification, and social supports – not to mention challenges obtaining essential documents like birth certificates, Social Security cards, and driver’s licenses or other identification. The service gaps between these predictable needs and the resources available to people in the critical time period following release contributes directly to both early deaths and the cycle of re-incarceration (“recidivism”) for far too many people.
In 2019, we wrote about the extreme gap between needed and available reentry services for women, who report a higher need for services than men, but who are frequently overlooked in reentry programs targeted at the much larger population of incarcerated men.
Since that publication, journalists, advocates, and service providers have reached out asking about the total number of people released from prisons and jails in their state each year. While these are numbers you might expect would be easy to find, they aren’t published regularly in annual reports on prison and jail populations by the Bureau of Justice Statistics. In fact, the annual data collected by the federal government about local jails (the Annual Survey of Jails) cannot generally be broken down by state; only the more infrequently-collected Census of Jails data can be used to make state-level findings.

To aid those who need these statistics to make the case for devoting more resources to reentry services, or simply wish to understand the scale of reentry in their state, we compiled the most recent available Bureau of Justice Statistics data about releases from both prisons and jails, by state:
Releases from prisons and jails in 2019, by state or other jurisdiction
| State | Prison releases | Jail releases | Total releases |
|---|---|---|---|
| Alabama | 12,920 | 285,461 | 298,381 |
| Alaska | 1,714 | 5,284 | 6,998 |
| Arizona | 12,933 | 189,370 | 202,303 |
| Arkansas | 10,259 | 170,060 | 180,319 |
| California | 37,462 | 949,971 | 987,433 |
| Colorado | 9,840 | 217,597 | 227,437 |
| Connecticut | 4,473 | N/A | 4,473 |
| Delaware | 2,269 | N/A | 2,269 |
| District of Columbia | N/A* | 10,473 | 10,473 |
| Federal (BOP) | 50,692 | N/A | 50,692 |
| Florida | 29,737 | 656,962 | 686,699 |
| Georgia | 17,200 | 576,856 | 594,056 |
| Hawaii | 1,654 | N/A | 1,654 |
| Idaho | 4,416 | 70,068 | 74,484 |
| Illinois | 23,791 | 253,962 | 277,753 |
| Indiana | 10,988 | 243,482 | 254,470 |
| Iowa | 7,114 | 133,703 | 140,817 |
| Kansas | 6,007 | 159,332 | 165,339 |
| Kentucky | 19,580 | 291,455 | 311,035 |
| Louisiana | 16,835 | 249,332 | 266,167 |
| Maine | 755 | 31,032 | 31,787 |
| Maryland | 7,408 | 79,185 | 86,593 |
| Massachusetts | 2,362 | 59,477 | 61,839 |
| Michigan | 11,440 | 280,341 | 291,781 |
| Minnesota | 6,964 | 201,329 | 208,293 |
| Mississippi | 6,971 | 149,942 | 156,913 |
| Missouri | 18,533 | 264,369 | 282,902 |
| Montana | 2,475 | 42,423 | 44,898 |
| Nebraska | 2,336 | 66,855 | 69,191 |
| Nevada | 6,646 | 157,020 | 163,666 |
| New Hampshire | 1,339 | 22,417 | 23,756 |
| New Jersey | 8,182 | 118,749 | 126,931 |
| New Mexico | 3,528 | 112,716 | 116,244 |
| New York | 20,791 | 167,614 | 188,405 |
| North Carolina | 17,106 | 382,070 | 399,176 |
| North Dakota | 1,358 | 46,509 | 47,867 |
| Ohio | 20,275 | 396,059 | 416,334 |
| Oklahoma | 9,365 | 207,432 | 216,797 |
| Oregon | 5,870 | 182,921 | 188,791 |
| Pennsylvania | 17,897 | 201,432 | 219,329 |
| Rhode Island | 720 | N/A | 720 |
| South Carolina | 6,208 | 181,834 | 188,042 |
| South Dakota | 4,576 | 66,673 | 71,249 |
| Tennessee | 14,205 | 397,931 | 412,136 |
| Texas | 78,119 | 993,910 | 1,072,029 |
| Utah | 4,017 | 96,963 | 100,980 |
| Vermont | 2,528 | N/A | 2,528 |
| Virginia | 12,602 | 284,217 | 296,819 |
| Washington | 24,455 | 266,757 | 291,212 |
| West Virginia | 4,124 | 45,942 | 50,066 |
| Wisconsin | 5,820 | 207,820 | 213,640 |
| Wyoming | 1,010 | 28,422 | 29,432 |
| Total | 610,235 | 10,203,729 | 10,813,964 |
Often, conversations about reentry focus on people released from prisons rather than jails, because people in prison are generally confined for much longer than people in jail and because felony convictions make finding housing and employment particularly difficult. We decided to include jail releases here because while many people who go to jail are released quickly, others languish behind bars for months, often without being convicted or sentenced. Moreover, particularly vulnerable people are often arrested, jailed, and released repeatedly, and these individuals have high levels of need for community-based supports rather than punishment. For more information about the needs of people in jail, see our report Arrest, Release, Repeat, and for more on the unmet needs of people in prisons, see Beyond the Count and Chronic Punishment.
Looking for releases to your local community?
For readers hoping for prison release data more local than the state level, we can offer a few suggestions:
First, as we recently explained in a separate post, we have published a series of reports about the places people in prison call home in the states that have ended prison gerrymandering. In these states, home address data is collected by the prison system, which we have aggregated at various geographic levels including counties, cities, ZIP codes, and even neighborhoods in select cities. Assuming that people released from prison each year are distributed across the state in a way that’s similar to the distribution of people in prison, you can use this data to estimate how many people from each of these places are released each year. You simply need to know the state-level ratio of annual prison releases (from the table above) to the number of people reallocated to their home addresses in our state-level reports. You can then multiply that ratio by the number of people in prison from the geographic area you are interested in to arrive at an estimate of how many people from that area are released each year.
For example: Let’s say you want to estimate how many people from Buffalo, New York are released from New York prisons annually. In New York state, there were 20,903 people released from prison in 2019. And according to our report, 39,027 people were reallocated to their home addresses from state prisons, which is a ratio of 53.5% (20,903 divided by 39,027). You can then multiply that ratio by the number of people in prison from Buffalo (1,703) to estimate that about 912 Buffalo residents are released from New York prisons each year.
For readers from states that have yet to end prison gerrymandering, other proxy measures may work well. Many states publish data on the counties that send people to prison (“county of commitment”). The Vera Institute of Justice uses these data, wherever possible, to break down state prison populations to the county level in its Trends tool (under the label “prison incarceration”). While “county of commitment” data refer to where an incarcerated person was convicted and sentenced – not their home address – it’s a safe bet that many people are from the same county as where they were convicted, as most criminal activity occurs close to home. To estimate releases based on county of commitment numbers, you can follow the same method described above, but substitute the county of commitment number for the data from our reports.
Looking for a more recent estimate of jail releases in your state?
Again, because jails are operated locally and the Bureau of Justice Statistics only surveys all jails every six years or so in the Census of Jails, precise data on the number of people released from all the jails across a given state are not available for every year. However, the fact that most people are in jail for a relatively short period of time means that in most states, the number of admissions is very close to the number of releases each year. Similarly, the number of arrests tracks closely with the number of admissions; the Vera Institute of Justice points out that for every 100 arrests, there are 99 jail admissions. So if you know the number of arrests or jail admissions in your state in a given year, that number is likely quite close to the number of jail releases.
We hope this data and the links help you with your advocacy in your state.


Something needs to be done with the changing of laws. Apartment buildings, duplexes and the like should not be allowed to discriminate against felons. Either that, or just as the government helps people on welfare with housing they need to find alternative housing for felons. When I was released from prison I worked for$20 a day 16 hours a day because I had to have a job. They say people can’t go back more than 10 years on background checks yet there is nothing stopping them from doing it.