HELP US END MASS INCARCERATION
The Prison Policy Initiative uses research, advocacy, and organizing to dismantle mass incarceration. We’ve been in this movement for 23 years, thanks to individual donors like you.
Can you help us sustain this work?
Thank you,
Peter Wagner, Executive Director Donate
Can you help us sustain this work?
Thank you,
Peter Wagner, Executive Director Donate

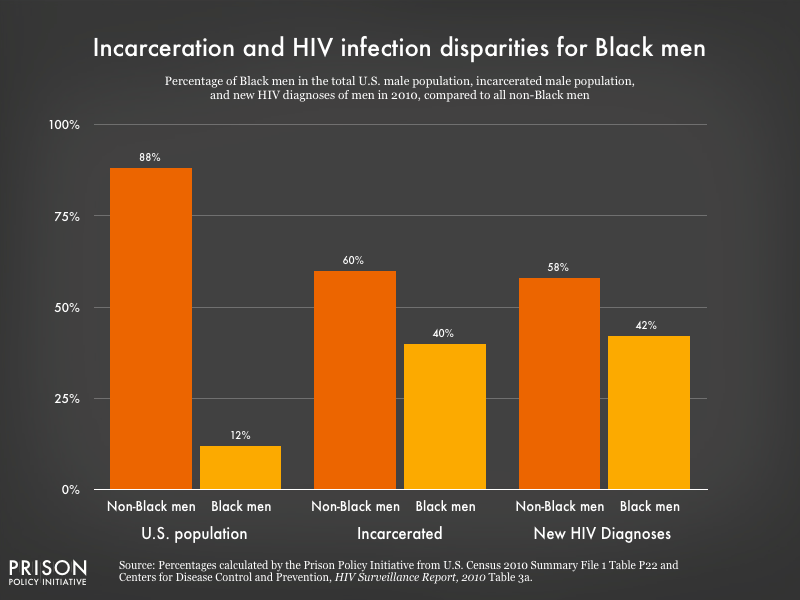
Data Source: Percentages calculated by the Prison Policy Initiative from U.S. Census 2010 Summary File 1 Table P22 and Centers for Disease Control and Prevention, HIV Surveillance Report, 2010 Table 3a. (Graph: Peter Wagner, 2017)
This graph originally appeared in The parallel epidemics of incarceration & HIV in the Deep South.


