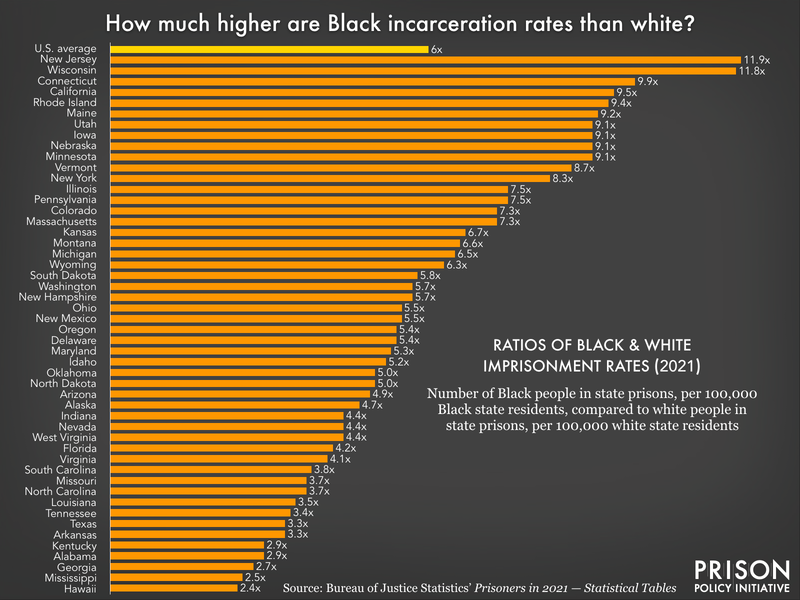
Data Source: Bureau of Justice Statistics' Prisoners in 2021 — Statistical Tables. (Graph: Leah Wang, 2023)
This graph originally appeared in Updated data and charts: Incarceration stats by race, ethnicity, and gender for all 50 states and D.C.
Events
- September 14, 2024:
Our advocacy department will host a workshop at the MacArthur Justice Center’s Realizing Releases convening. The workshop will provide strategies for investigating state parole systems.
Register for the convening here.
Not near you?
Invite us to your city, college or organization.


