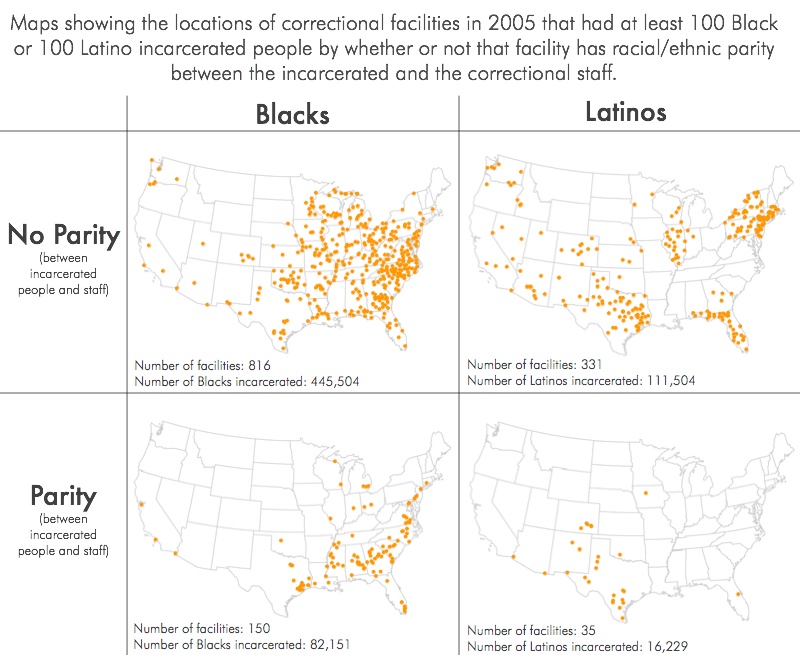
Data Source: Prison Policy Initiative analysis of Census of State and Federal Adult Correctional Facilities, 2005, ICPSR 24642. (Map: Peter Wagner, 2015)
This map originally appeared in In prisons, Blacks and Latinos do the time while Whites get the jobs.
The maps show that most correctional facilities with more than 100 incarcerated Blacks or Latinos are located in places where hiring Black and Latino staff in proportional numbers to the incarcerated population is extremely difficult. The small number of facilities that have such parity are, unsurprisingly, located in parts of the country with large populations of Black or Latino residents.
(Not shown are 670 facilities that incarcerated less than 100 Blacks and 1,089 facilities that incarcerated less than 100 Latinos. Also excluded from our analysis were 141 facilities that did not report how many Blacks were incarcerated and 324 facilities that did not report how many Latinos were incarcerated.)
Events
- September 14, 2024:
Our advocacy department will host a workshop at the MacArthur Justice Center’s Realizing Releases convening. The workshop will provide strategies for investigating state parole systems.
Register for the convening here.
Not near you?
Invite us to your city, college or organization.


