HELP US END MASS INCARCERATION
The Prison Policy Initiative uses research, advocacy, and organizing to dismantle mass incarceration. We’ve been in this movement for 23 years, thanks to individual donors like you.
Can you help us sustain this work?
Thank you,
Peter Wagner, Executive Director Donate
Can you help us sustain this work?
Thank you,
Peter Wagner, Executive Director Donate

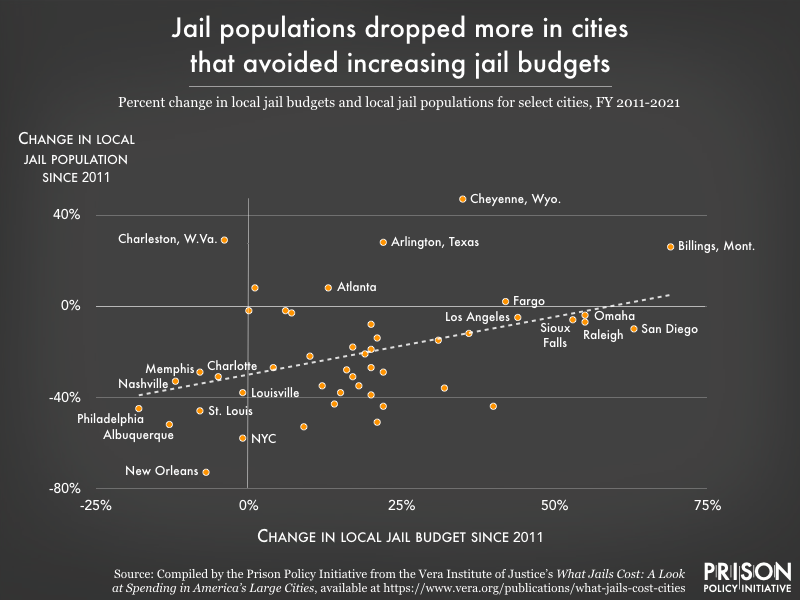
Data Source: Compiled by the Prison Policy Initiative from the Vera Institute of Justice's What Jails Cost: A Look at Spending in America's Largest Cities, available at https://www.vera.org/publications/what-jails-cost-cities. (Graph: Emily Widra, 2021)
This graph originally appeared in Jail incarceration rates vary widely, but inexplicably, across U.S. cities.


