HELP US END MASS INCARCERATION
The Prison Policy Initiative uses research, advocacy, and organizing to dismantle mass incarceration. We’ve been in this movement for 23 years, thanks to individual donors like you.
Can you help us sustain this work?
Thank you,
Peter Wagner, Executive Director Donate
Can you help us sustain this work?
Thank you,
Peter Wagner, Executive Director Donate

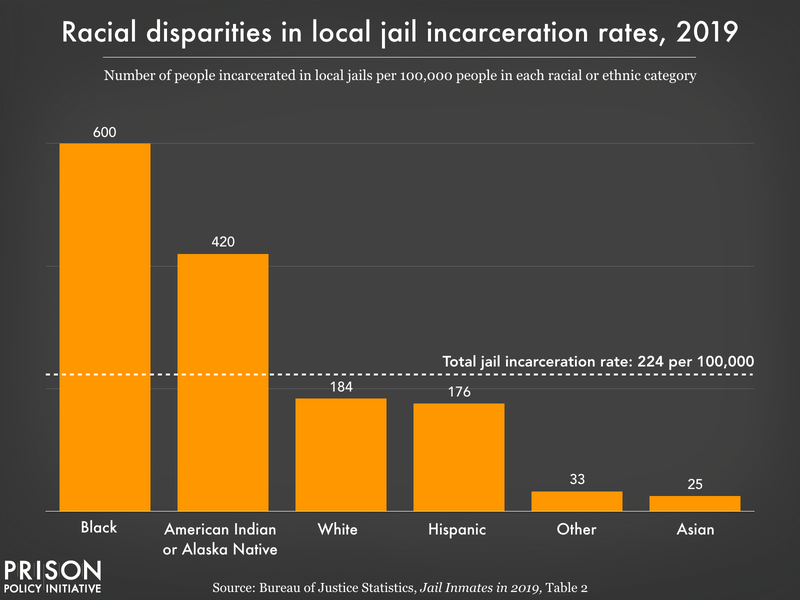
Data Source: Bureau of Justice Statistics Jail Inmates in 2019 Table 2. (Graph: Wendy Sawyer, 2022)
This graph originally appeared in Updated charts provide insights on racial disparities, correctional control, jail suicides, and more.
The original version of this chart, showing 2018 rates, appeared in Visualizing the racial disparities in mass incarceration.


