HELP US END MASS INCARCERATION
The Prison Policy Initiative uses research, advocacy, and organizing to dismantle mass incarceration. We’ve been in this movement for 23 years, thanks to individual donors like you.
Can you help us sustain this work?
Thank you,
Peter Wagner, Executive Director Donate
Can you help us sustain this work?
Thank you,
Peter Wagner, Executive Director Donate

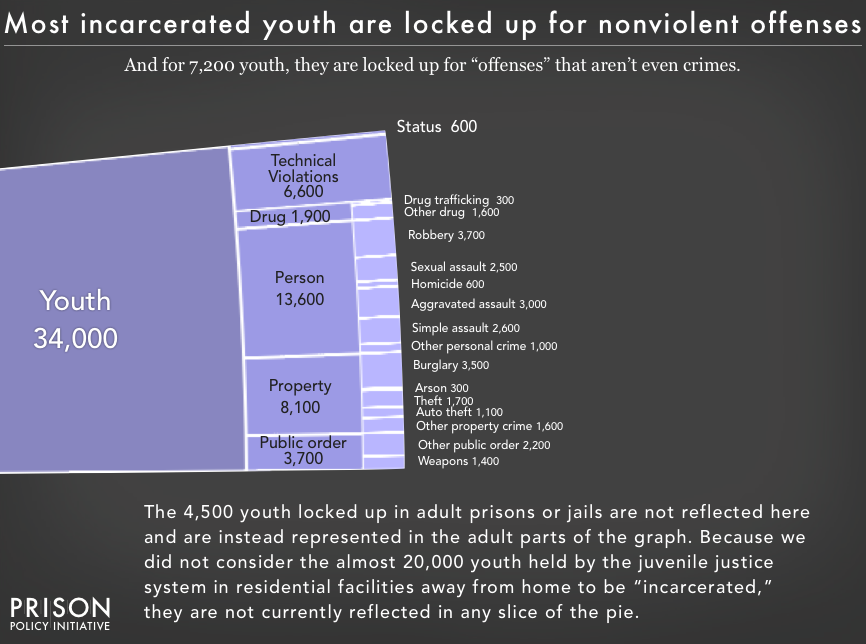
Data Source: For information about the data visit the data section of the report. (Graph: Peter Wagner & Bernadette Rabuy, 2016)
This graph originally appeared in Mass Incarceration: The Whole Pie 2017.
Chart showing the number and portion of youth locked up by offense types, showing that most incarcerated youth are locked up for nonviolent offenses, and that 7,200 youth are incarcerated for 'offenses' that are not even crimes. The graph notes that it does not include the 4,500 youth locked up in adult prisons or jails nor the almost 20,000 youth held by the juvenile justice system in residential facilities away from home.


