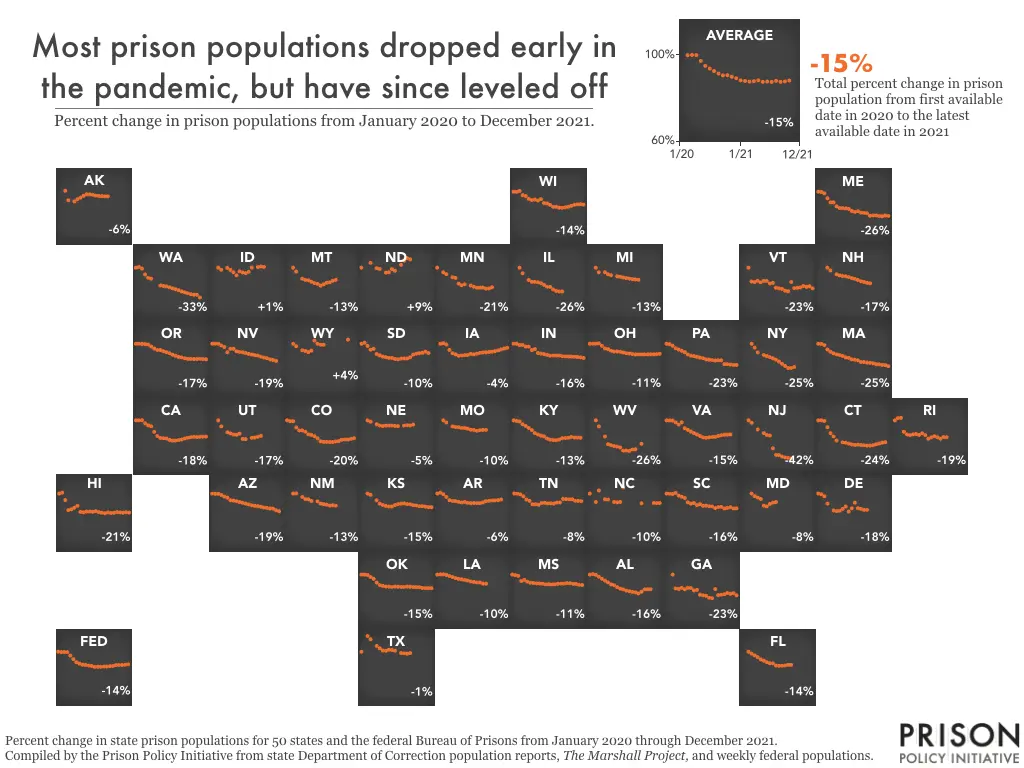
Data Source: Compiled by the Prison Policy Initiative from state Department of Correction population reports, The Marshall Project, and weekly federal populations. (Graph: Emily Widra, 2022)
This graph originally appeared in State prisons and local jails appear indifferent to COVID outbreaks, refuse to depopulate dangerous facilities.
For the available population data for these 50 states and the Bureau of Prisons, see Appendix A.


