HELP US END MASS INCARCERATION
The Prison Policy Initiative uses research, advocacy, and organizing to dismantle mass incarceration. We’ve been in this movement for 23 years, thanks to individual donors like you.
Can you help us sustain this work?
Thank you,
Peter Wagner, Executive Director Donate
Can you help us sustain this work?
Thank you,
Peter Wagner, Executive Director Donate

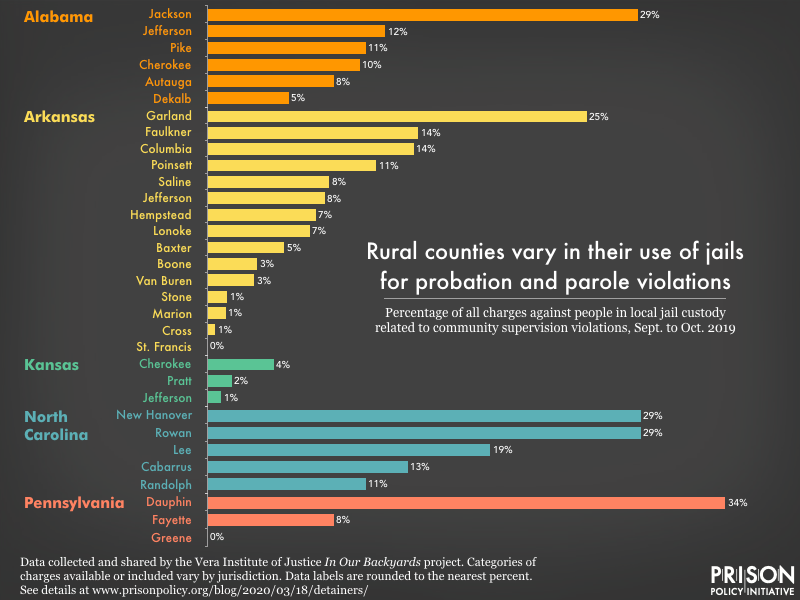
Data Source: Data collected and shared by the Vera Institute of Justice In Our Backyards project. Categories of charges available or included vary by jurisdiction. Data labels are rounded to the nearest percent. See details at https://www.prisonpolicy.org/blog/2020/03/18/detainers/. (Graph: Wendy Sawyer, 2020)
This graph originally appeared in Technical violations, immigration detainers, and other bad reasons to keep people in jail.


