HELP US END MASS INCARCERATION
The Prison Policy Initiative uses research, advocacy, and organizing to dismantle mass incarceration. We’ve been in this movement for 23 years, thanks to individual donors like you.
Can you help us sustain this work?
Thank you,
Peter Wagner, Executive Director Donate
Can you help us sustain this work?
Thank you,
Peter Wagner, Executive Director Donate

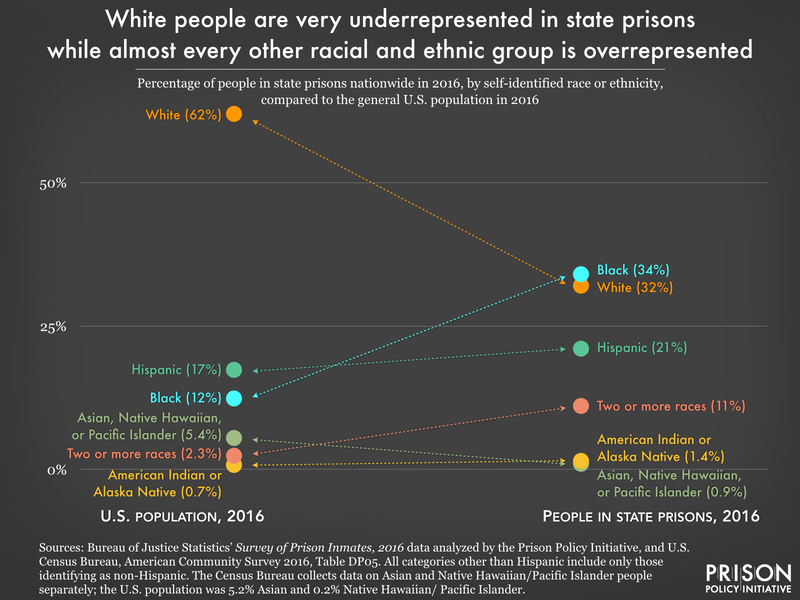
Data Source: Bureau of Justice Statistics’ Survey of Prison Inmates, 2016 data analyzed by the Prison Policy Initiative, and U.S. Census Bureau, American Community Survey 2016, Table DP05. (Graph: Leah Wang, 2022)
This graph originally appeared in Beyond the count: A deep dive into state prison populations.
All categories other than Hispanic include only those identifying as non-Hispanic. The Census Bureau collects data on Asian and Native Hawaiian/Pacific Islander people separately; the U.S. population was 5.2% Asian and 0.2% Native Hawaiian/Pacific Islander. The underlying data for this graphic can be found in the report’s appendix tables.


