Can you help power the movement today?
—Peter Wagner, Executive Director Donate
Prisons of Poverty:
Uncovering the pre-incarceration incomes of the imprisoned
By Bernadette Rabuy and Daniel Kopf
July 9, 2015
Press release
Leer en español
Correctional experts of all political persuasions have long understood that releasing incarcerated people to the streets without job training, an education, or money is the perfect formula for recidivism and re-incarceration. While the fact that people released from prison have difficulties finding employment is well-documented, there is much less information on the role that poverty and opportunity play in who ends up behind bars in the first place.
Using an underutilized data set from the Bureau of Justice Statistics,1 this report provides hard numbers on the low incomes of incarcerated men and women from before they were locked up.
Findings
The findings are as predictable as they are disturbing. The American prison system is bursting at the seams with people who have been shut out of the economy and who had neither a quality education2 nor access to good jobs.3 We found that, in 2014 dollars, incarcerated people had a median annual income of $19,185 prior to their incarceration, which is 41% less than non-incarcerated people of similar ages.4
The gap in income is not solely the product of the well-documented disproportionate incarceration of Blacks and Hispanics, who generally earn less than Whites. We found that incarcerated people in all gender, race, and ethnicity groups earned substantially less prior to their incarceration than their non-incarcerated counterparts of similar ages:
| Incarcerated people (prior to incarceration) | Non-incarcerated people | ||||
|---|---|---|---|---|---|
| Men | Women | Men | Women | ||
| All | $19,650 | $13,890 | $41,250 | $23,745 | |
| Black | $17,625 | $12,735 | $31,245 | $24,255 | |
| Hispanic | $19,740 | $11,820 | $30,000 | $15,000 | |
| White | $21,975 | $15,480 | $47,505 | $26,130 | |
| Men | Women | |
|---|---|---|
| All | 52% | 42% |
| Black | 44% | 47% |
| Hispanic | 34% | 21% |
| White | 54% | 41% |
While the gap in income is most dramatic for White men, White men have the highest incomes. By contrast, the income gap is smallest for Hispanic women, but Hispanic women have the lowest incomes.
Not only are the median incomes of incarcerated people prior to incarceration lower than non-incarcerated people, but incarcerated people are dramatically concentrated at the lowest ends of the national income distribution:
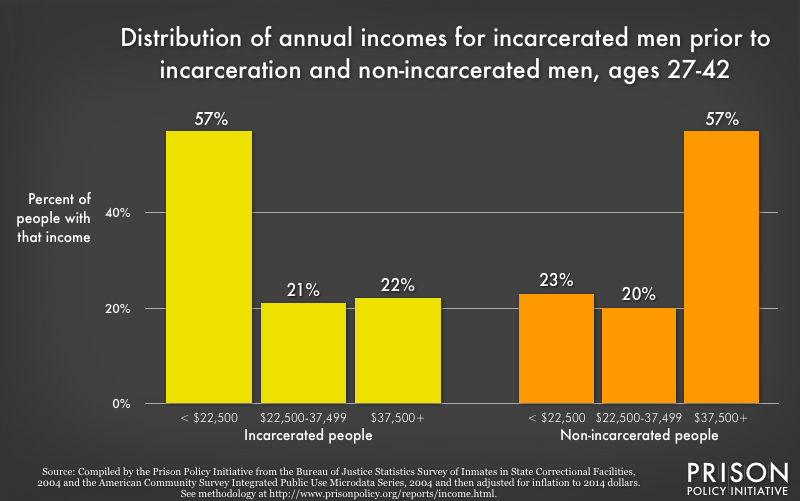 Figure 3. Incarcerated men are concentrated at the lowest ends of the national income distribution. The median incarcerated man had a pre-incarceration income that is 48% that of the median non-incarcerated man.
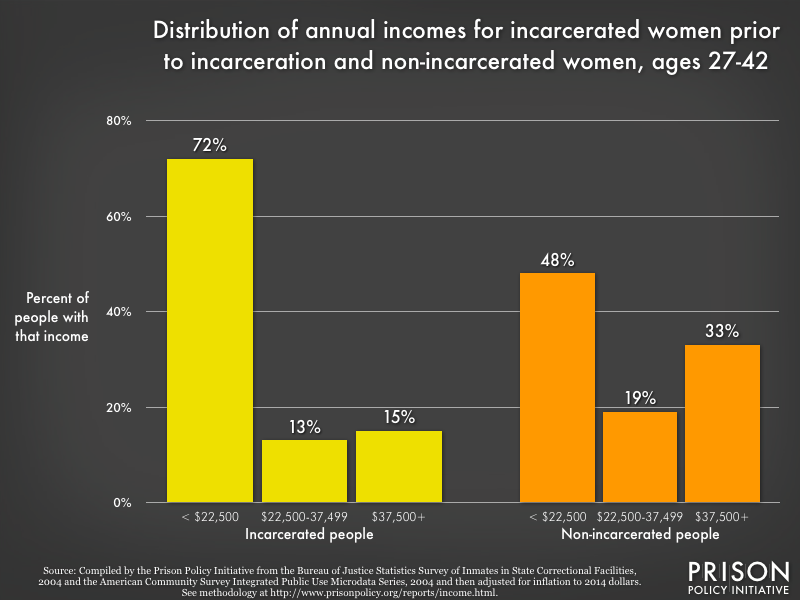 Figure 4. Incarcerated women are concentrated at the lowest ends of the national income distribution. The median incarcerated woman had a pre-incarceration income that is 58% that of the median non-incarcerated woman.
Conclusion
Our society has, in the name of being tough on crime, made a series of policy choices that have fueled a cycle of poverty and incarceration. We send large numbers of people with low levels of education and low skills to prison, and then when they leave just as penniless as they were when they went in, we expect them to bear the burden of legally-acceptable employment discrimination.
Acknowledging, as this report makes possible, that the people in prison were, before they went to prison, some of the poorest people in this country makes it even more important that we make policy choices that can break the cycle of poverty and incarceration.
Reversing the decades-old policies that make it more difficult for people with criminal records to succeed may require political courage, but the options are plentiful and often straightforward. Federal, state, and local governments can repeal laws restricting incarcerated and formerly incarcerated people's access to welfare, public housing, Pell Grants, and student loans, and the private sector can voluntarily end its discrimination against people with criminal convictions.5 These reforms can help individuals succeed, but we will also need to explore how our single-minded focus on imprisonment blinded us to the needs of entire communities.6
Permanently ending the era of mass incarceration will require reversing the decades of neglect that denied our most vulnerable communities access to good jobs, reliable transportation, safe housing, and good schools. Making these long-delayed investments in the basic building blocks of strong and stable communities will ensure that, once we turn the corner on mass incarceration, we never turn back.
Methodology
Background
This is not the first report to address the incomes of incarcerated people. The Bureau of Justice Statistics (BJS) collects this data periodically (most recently in 2004 with another survey scheduled for 2015–2016) but does not routinely publish the results in a format that can be accessed without statistical software.7 The BJS last published a complete analysis8 of the survey results in 1993 and used the 2004 data in a narrower study of incarcerated parents of minor children.9 Sociologists Bruce Western and Becky Pettit used a portion of this same data set in their groundbreaking books and articles on the impact of incarceration on men. Our intent in this report has been to make this data for both men and women available and accessible to the public.
This report was not intended to make the point that incarceration causes poverty, although there is extensive research on that topic (see below for recommended reading). Because the Prison Policy Initiative is regularly asked about the role that poverty plays in who ends up behind bars, this report is aimed at answering a different question: are incarcerated people poorer than non-incarcerated people? In particular, we wanted to address questions like the morality of allowing private telephone companies to charge the families of incarcerated people $1/minute for phone calls home from prisons and jails.
To be clear, this report relies on the Bureau of Justice Statistics survey from 2004, which is both quite old and the newest available. While we look forward to the Bureau of Justice Statistics releasing the raw data from their 2015–2016 survey in two to four years, we know of no reason or trend that would make relying on the 2004 survey less reliable than the alternatives of using data from 1993 or no data at all.
Further research should look at the effects of educational attainment and prior sentences on pre-incarceration incomes and identify policies that could address those disparities.
Data sources and process
This report is the result of a collaboration between Bernadette Rabuy, Policy and Communications Associate at the Prison Policy Initiative, and data scientist Daniel Kopf, who joined our Young Professionals Network in February 2015.
Together, we studied the BJS Survey of Inmates in State Correctional Facilities, 200410 relying in particular on the questions listed below and then developing a way to make the data comparable to non-incarcerated people. Notably, our data only includes the incomes of people incarcerated in state prisons, not federal prisons or county jails.
- S7Q11c. Which category on this card represents your personal monthly income from ALL sources for the month before your arrest?
- S1Q1a. Sex
- S1Q2a. What is your date of birth?
- S1Q3a. Are you of Spanish, Latino, or Hispanic origin?
- S1Q3c. Which of these categories describes your race?
The non-incarcerated data comes from the Census Bureau's American Community Survey (ACS), specifically from the Integrated Public Use Microdata Series (IPUMS).11 We used data from 2004 both because this was the same year as the incarcerated survey data, and because the ACS in 2004 included only people in households and did not include prisons and other group quarters.12 (Given that in 2004, 12% of Black men in their 20s were incarcerated, a data source that included incarcerated people in the "all population" would have resulted in a misleading comparison.)
Because income is correlated with age and because the incarcerated population trends younger than the general U.S. population, we thought it would be most accurate to compare people of similar ages. We limited our study to the 25th and 75th percentiles of ages for incarcerated people (ages 27–42), and we used the same age range for the non-incarcerated population.
To make all of this data more accessible and useful, we converted all data in two ways: We converted monthly incomes to annual incomes by multiplying by 12, and we multiplied each income by 1.25 to adjust for inflation from 2004 to 2014, as provided by the Bureau of Labor Statistics CPI Inflation Calculator.13 (Because 2015 is not yet over, the 2015 index value is based only on the latest monthly values and therefore will change from month to month.)
In addition, to provide an estimated median income for each incarcerated race/ethnicity/gender group from the BJS "grouped frequency" data, we followed these steps:
- Take the distance between the smallest and largest number in the group containing the median
- Multiply this number by the following: ( ( (total data points/2) - total data points in groups with lower numbers) / data points in group containing median )
- Add lowest number in group containing the median
On definitions
Note that throughout this report, the incomes for incarcerated people are the incomes incarcerated people reported earning before their arrest, not the incomes they earned through prison labor. For incarcerated people and non-incarcerated people, incomes include welfare and other public assistance. For incarcerated people, incomes also include illegal sources of income.
We use "Non-incarcerated" to refer to people in households, and thereby exclude people in group quarters, including people in correctional facilities, psychiatric hospitals, college/university housing, or residential treatment facilities.
Our data on "Blacks" and "Whites," relies on data for Non-Hispanic Blacks and Non-Hispanic Whites. The federal government defines Black and White as races while Hispanic is defined as an ethnicity (and, therefore, it is possible to identify as both Hispanic and White or Hispanic and Black). Our data for both incarcerated people and non-incarcerated people allowed us to avoid overlap by separately talking about Non-Hispanic Whites, Non-Hispanic Blacks, and Hispanics.
Recommended reading and other data sources
Visionary research by sociologists Bruce Western and Becky Pettit has also relied on this same 2004 BJS state prison data set in order to provide a more realistic picture of the plight of young black men in the U.S. Western and Pettit have also utilized data from the other BJS surveys of inmates (Survey of Inmates of Local Jails or Survey of Inmates of Federal Correctional Facilities) and the National Longitudinal Survey of Youth to fill the gap in data left by government sources such as the Census Bureau's Current Population Survey (CPS). The Current Population Survey is the large monthly labor force survey conducted by the Census Bureau, but, because it only considers households, the CPS excludes incarcerated people.
Over the years, Western and Pettit have produced groundbreaking books and articles that were useful starting points for this report, including:
- Bruce Western, Punishment and Inequality in America (New York: Russell Sage Foundation, 2006)
- Becky Pettit, Invisible Men: Mass Incarceration and the Myth of Black Progress (New York: Russell Sage Foundation, 2012)
- Bruce Western and Becky Pettit, "Incarceration & social inequality" Dædalus (Summer 2010)
- The Economic Mobility Project and the Public Safety Performance Project, Collateral Costs: Incarceration's Effect on Economic Mobility (Washington, D.C.: The Pew Charitable Trusts, 2010).
Appendix
The 2004 BJS survey asked incarcerated people what their personal monthly income was the month before their arrest. The data in this appendix is presented in monthly incomes and has not been adjusted for inflation.
The following tables and graphs allow for comparisons between the incomes of incarcerated people prior to incarceration and the incomes of non-incarcerated people for each of the income categories that BJS provides respondents in its Survey of Inmates in State Correctional Facilities. The graphs also show that incarcerated people are dramatically concentrated at the lower ends of the national income distribution.
| Incarcerated people (prior to incarceration) | Non-incarcerated people | ||||
|---|---|---|---|---|---|
| Men | Women | Men | Women | ||
| All | $1,310 | $926 | $2,750 | $1,583 | |
| Black | $1,175 | $849 | $2,083 | $1,617 | |
| Hispanic | $1,316 | $788 | $2,000 | $1,000 | |
| White | $1,465 | $1,032 | $3,167 | $1,742 | |
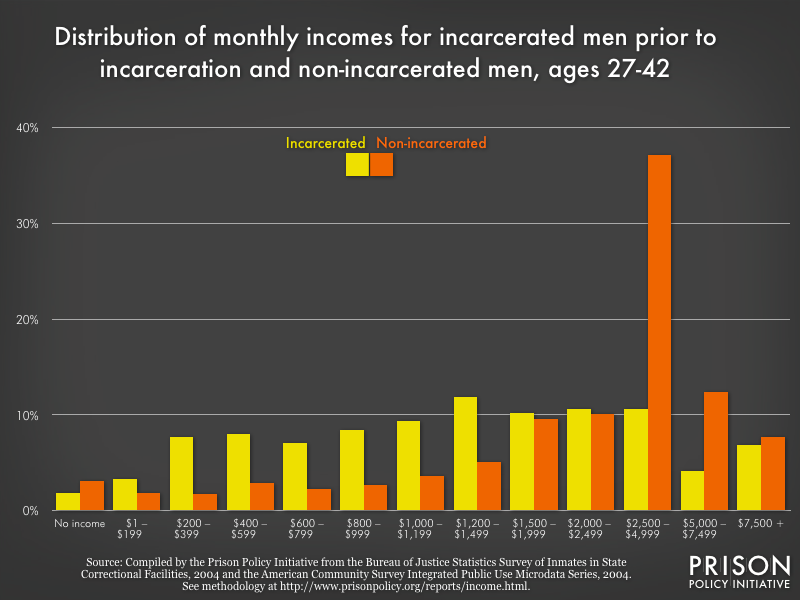 Figure 6. Distribution of monthly incomes for incarcerated men prior to incarceration and non-incarcerated men in 2004 dollars, ages 27-42
| Income category | Proportion of incarcerated men with that income (prior to incarceration) | Proportion of non-incarcerated men with that income |
|---|---|---|
| $0 | 1.82% | 3.10% |
| $1-199 | 3.25% | 1.84% |
| $200-399 | 7.66% | 1.68% |
| $400-599 | 8.03% | 2.87% |
| $600-799 | 7.05% | 2.30% |
| $800-999 | 8.44% | 2.71% |
| $1,000-1,199 | 9.39% | 3.61% |
| $1,200-1,499 | 11.90% | 5.07% |
| $1,500-1,999 | 10.21% | 9.56% |
| $2,000-2,499 | 10.63% | 10.10% |
| $2,500-4,999 | 10.64% | 37.11% |
| $5,000-7,499 | 4.15% | 12.41% |
| $7,500+ | 6.84% | 7.64% |
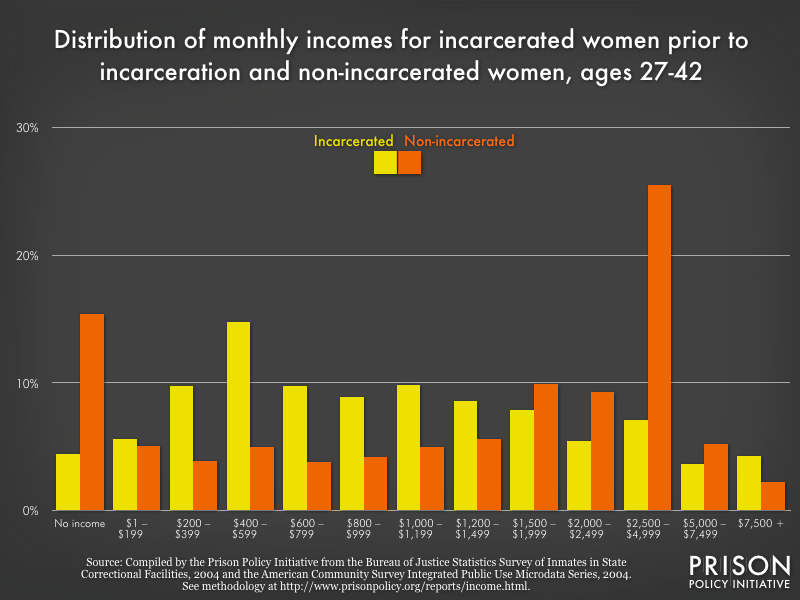 Figure 8. Distribution of monthly incomes for incarcerated women prior to incarceration and non-incarcerated women in 2004 dollars, ages 27–42. While most incarcerated people make less prior to incarceration than people on the outside, there is one interesting anomaly in the data for women not present in the data for men. More non-incarcerated women report no income at all than incarcerated women prior to incarceration. For both groups, the reported incomes include wages, welfare, and other public assistance, but since these are individual surveys, they do not include spousal income. It is likely that many of those non-incarcerated women with zero reported income are receiving support from their spouses.
| Income category | Proportion of incarcerated women with that income (prior to incarceration) | Proportion of non-incarcerated women with that income |
|---|---|---|
| $0 | 4.45% | 15.42% |
| $1-199 | 5.62% | 5.04% |
| $200-399 | 9.77% | 3.86% |
| $400-599 | 14.76% | 4.94% |
| $600-799 | 9.77% | 3.82% |
| $800-999 | 8.87% | 4.22% |
| $1,000-1,199 | 9.85% | 4.99% |
| $1,200-1,499 | 8.56% | 5.60% |
| $1,500-1,999 | 7.86% | 9.93% |
| $2,000-2,499 | 5.41% | 9.26% |
| $2,500-4,999 | 7.13% | 25.47% |
| $5,000-7,499 | 3.66% | 5.21% |
| $7,500+ | 4.30% | 2.24% |
Footnotes
Learn more about the Survey of Inmates in State Correctional Facilities. ↩
While the typical non-incarcerated person has at least a high school diploma, the typical incarcerated person does not. Using the same Bureau of Justice Statistics and Census Bureau data sets, we found that the median education of an incarcerated person ages 27–42 is 11 years completed, and the education gap is getting worse. In her book, Invisible Men, Becky Pettit finds that while the overall educational attainment of Americans has grown since 1980, the fraction of the incarcerated with less than a high school diploma grew over this same period. See Becky Pettit, Invisible Men: Mass Incarceration and the Myth of Black Progress (New York: Russell Sage Foundation, 2012), p 16. ↩
In the Baltimore community that sends the most people to state prison, Sandtown-Winchester/Harlem Park, more than half of the residents ages 16–64 are not employed. In addition, 61% of Sandtown-Winchester/Harlem Park's residents age 25 and older have less than a high school diploma. See Justice Policy Institute and Prison Policy Initiative, "Sandtown-Winchester/Harlem Park," The Right Investment? Corrections Spending in Baltimore City, February 2015. ↩
This is for people imprisoned in state prisons ages 27–42, which are the 25th and 75th percentiles of ages for incarcerated people based on the 2004 BJS survey data. The median annual income for incarcerated people ages 27–42 is $19,185 while the median annual income for non-incarcerated people ages 27–42 is $32,505. The median annual income for incarcerated men ages 27–42 is $19,650 while the median annual income for non-incarcerated men ages 27–42 is $41,250. The median annual income for incarcerated women ages 27–42 is $13,890 while the median annual income for non-incarcerated women ages 27–42 is $23,745. ↩
Julia Love, "Apple rescinds policy against hiring felons for construction work," San Jose Mercury News, April 9, 2015. ↩
The report, The Right Investment? Corrections Spending in Baltimore City, shows that the home communities of people imprisoned in Maryland's state prisons are places that experience disproportionate unemployment, greater reliance on public assistance, higher rates of school absence, higher rates of vacant and abandoned housing, and more addiction challenges. See Justice Policy Institute and Prison Policy Initiative, The Right Investment? Corrections Spending in Baltimore City (Easthampton, MA and Washington, D.C.: Justice Policy Institute and Prison Policy Initiative, February 25, 2015). ↩
Proposed Collection, 80 FR 9749 (Feb 24,2015). ↩
Allen Beck et al., Survey of State Prison Inmates, 1991 (Washington, D.C.: Bureau of Justice Statistics, May 1993), p 3. ↩
Lauren E. Glaze and Laura M. Maruschak, Parents in Prison and Their Minor Children, (Washington, D.C.: Bureau of Justice Statistics, March 2010). ↩
Learn more about the Survey of Inmates in State Correctional Facilities. ↩
Learn more about the U.S. Census Bureau's American Community Survey IPUMS database. ↩
See an explanation (link no longer available) of who is included in group quarters. ↩
See the Bureau of Labor Statistics CPI Inflation Calculator. ↩
Recommended Reading:

Advocacy Toolkit
Resources, tips, and best practices to help advocates working to end mass incarceration.

50 state incarceration profiles
All of our recent reports about prison/jail growth, racial disparities, and more, re-organized by state.

Mass Incarceration: The Whole Pie
The U.S. incarcerates nearly 2 million people. Where are they locked up and why? Read our report.
